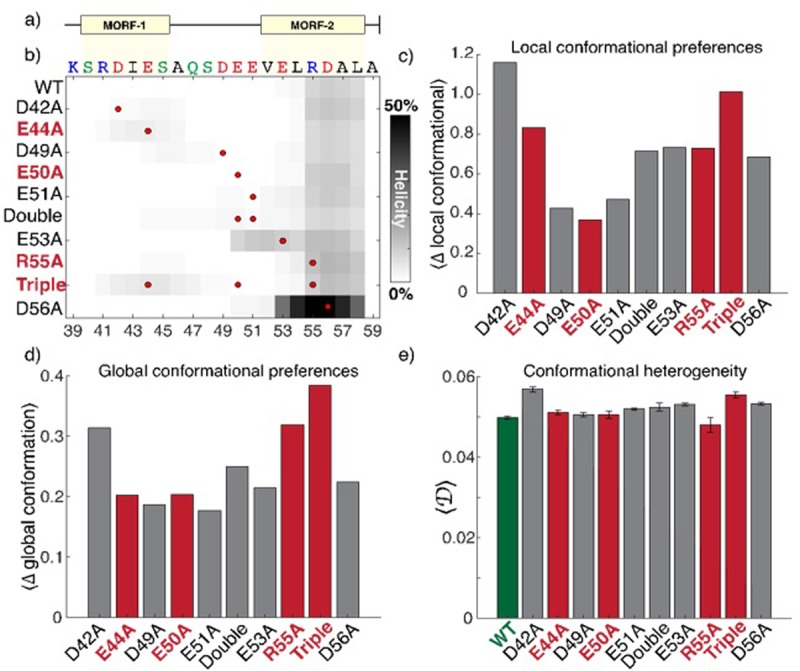
Fig 4. All-atom simulations of C-terminal residues 38–59.

a) Bioinformatics analysis of the primary sequence identified two putative molecular recognition features (MORFs) in the C-terminal region. b) All mutations except E53A and D56A had a minimal impact on residual helicity. The mutation position is shown as a red circle, darker shades represent enhanced helicity. c) Local conformational differences are calculated as the deviation from wildtype in terms of all pairwise intramolecular distances (see also S2 Fig). The mutants that show the smallest (E50A) and largest (triple) deviation from WT both significantly reduce iron binding, suggesting local interactions are not a useful metric for assessing the determinants of iron binding. d) Global conformational preferences are calculated in terms of the deviation from ensemble average shape (asphericity) and size (radius of gyration) 2D distributions (see also S3 Fig). Global conformational behaviour is again not predicting of iron binding with no discernible correlations identified. e) Global heterogeneity quantifies the extent of conformational disorder in terms of the distribution of structurally dissimilar conformations [49]. Larger values indicate higher heterogeneity. There is no correlation between heterogeneity and iron binding ability.
