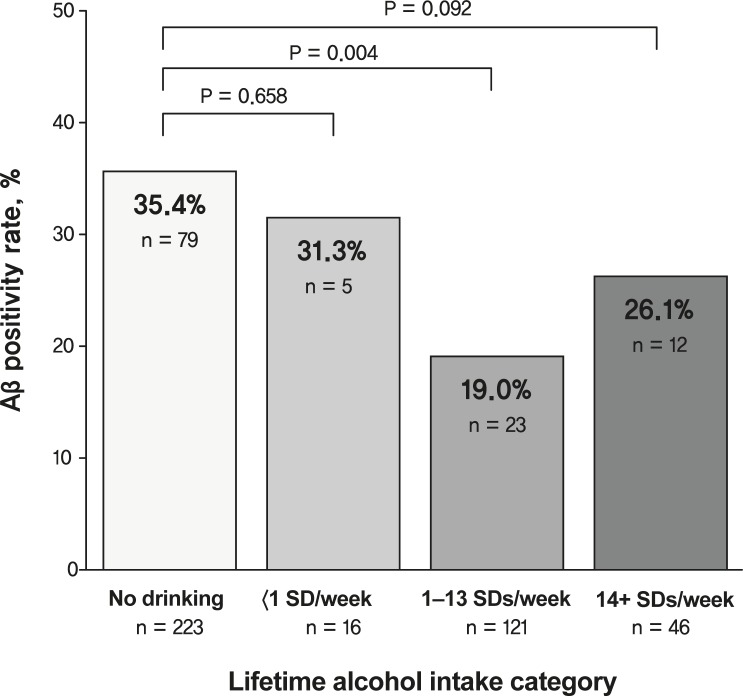
Fig 1. Aβ positivity rate according to lifetime alcohol intake category.
Comparison of Aβ positivity rate for no drinking versus <1 SD/week, no drinking versus 1–13 SDs/week, and no drinking versus 14+ SDs/week. Multiple logistic regression analyses were performed after adjusting for age, sex, apolipoprotein ε4, vascular risk score, Geriatric Depression Scale score, education, clinical diagnosis, occupational complexity, annual income, body weight, and body mass index. Aβ, amyloid-beta; SD, standard drink.

