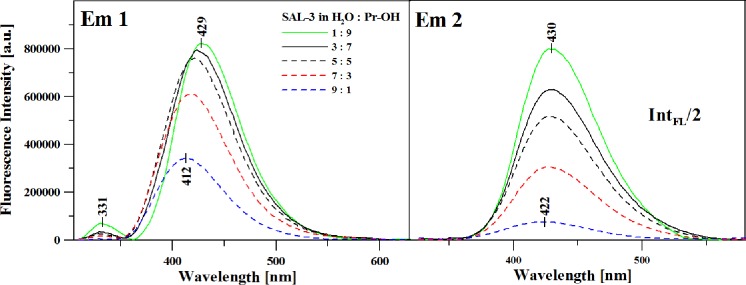
Fig 7.
Panel A: Fluorescence emission spectra corresponding to the spectra in Fig 6A. The excitation wavelength corresponded to the maximum of the absorption band. Panel B: Fluorescence emission spectra analogous to those in Panel A but with the excitation wavelength corresponding to the slopes of the absorption band–as described in the paper.

