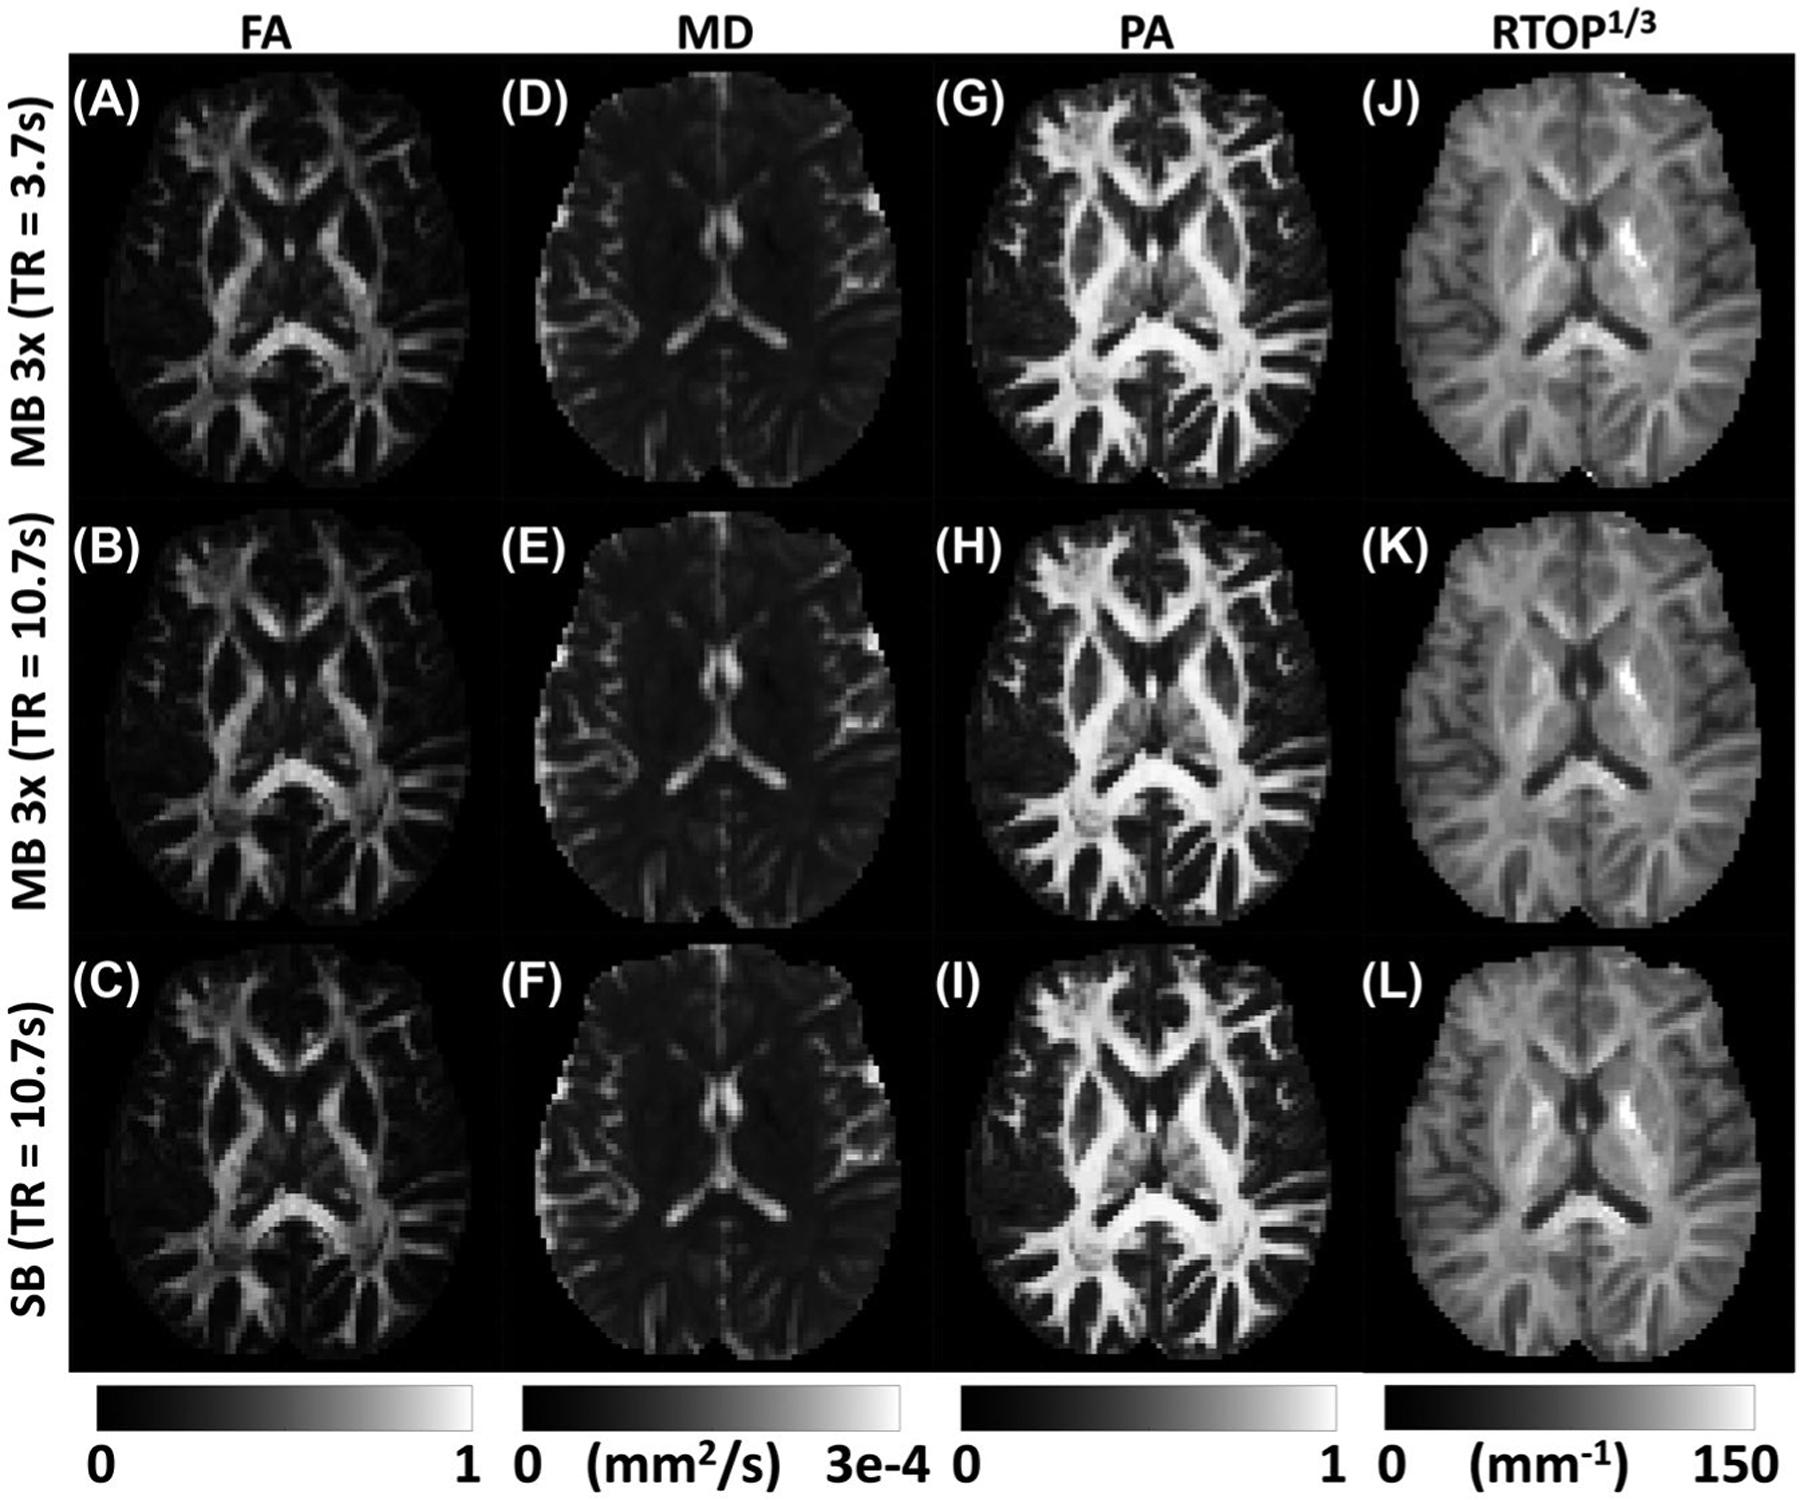
FIGURE 1.

Visualization of the average parameter maps derived from DTI and mean apparent propagator (MAP) MRI for 3 different collection schemes. The top row displays the maps derived from the minimum TR (i.e., 3.7 seconds) 3-times multiband (MB) sequence, followed by the 10.7-second TR 3-times MB sequence, and finally the parameter maps derived from the standard single-band (SB) sequence with minimum TR (10.7 seconds) for full-brain coverage. The first and second column show fractional anisotropy (FA) and mean diffusivity (MD, mm2/s) derived from DTI analysis. The third and fourth column show propagator anisotropy (PA) and return to origin probability maps (RTOP1/3, mm−1) derived from the MAP-MRI analysis
