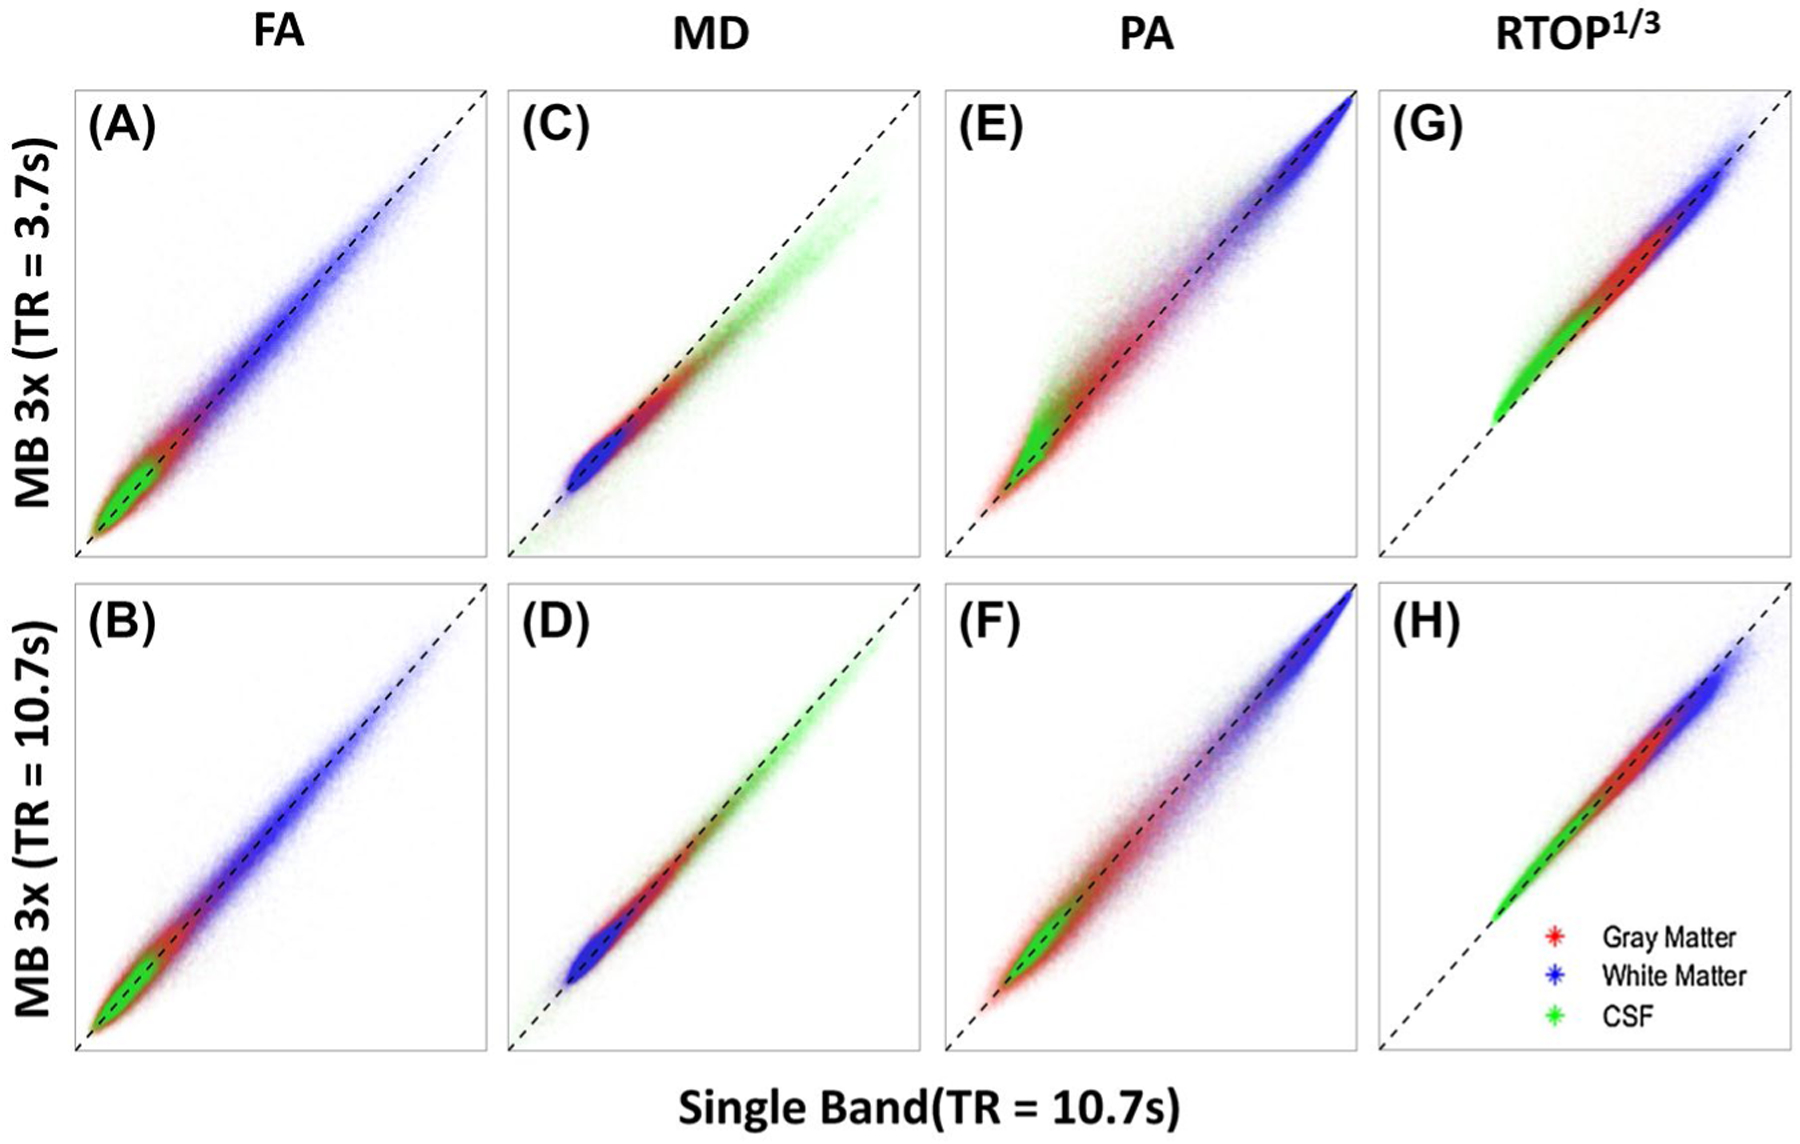
FIGURE 2.

Scatter plots of MB-derived parameter values plotted against SB-derived parameter values on a voxel-by-voxel basis for the entire brain. Voxels are categorized as either gray matter (red), white matter (blue), or CSF (green). The black, dashed line has a slope of 1.0 and is plotted for reference. The top row shows parameters derived from the MB sequence using a minimal TR (3.7 seconds) plotted against the same parameters derived from the SB sequence. The bottom row shows the parameters derived from the MB sequence using a matched TR (10.7 seconds) plotted against the same parameters derived from the SB sequence. The range for both the x-axis and y-axis is 0–1 for FA, 0–0.003 mm2/s for MD, 0–1 for PA, and 0–100 mm−1 for RTOP1/3
