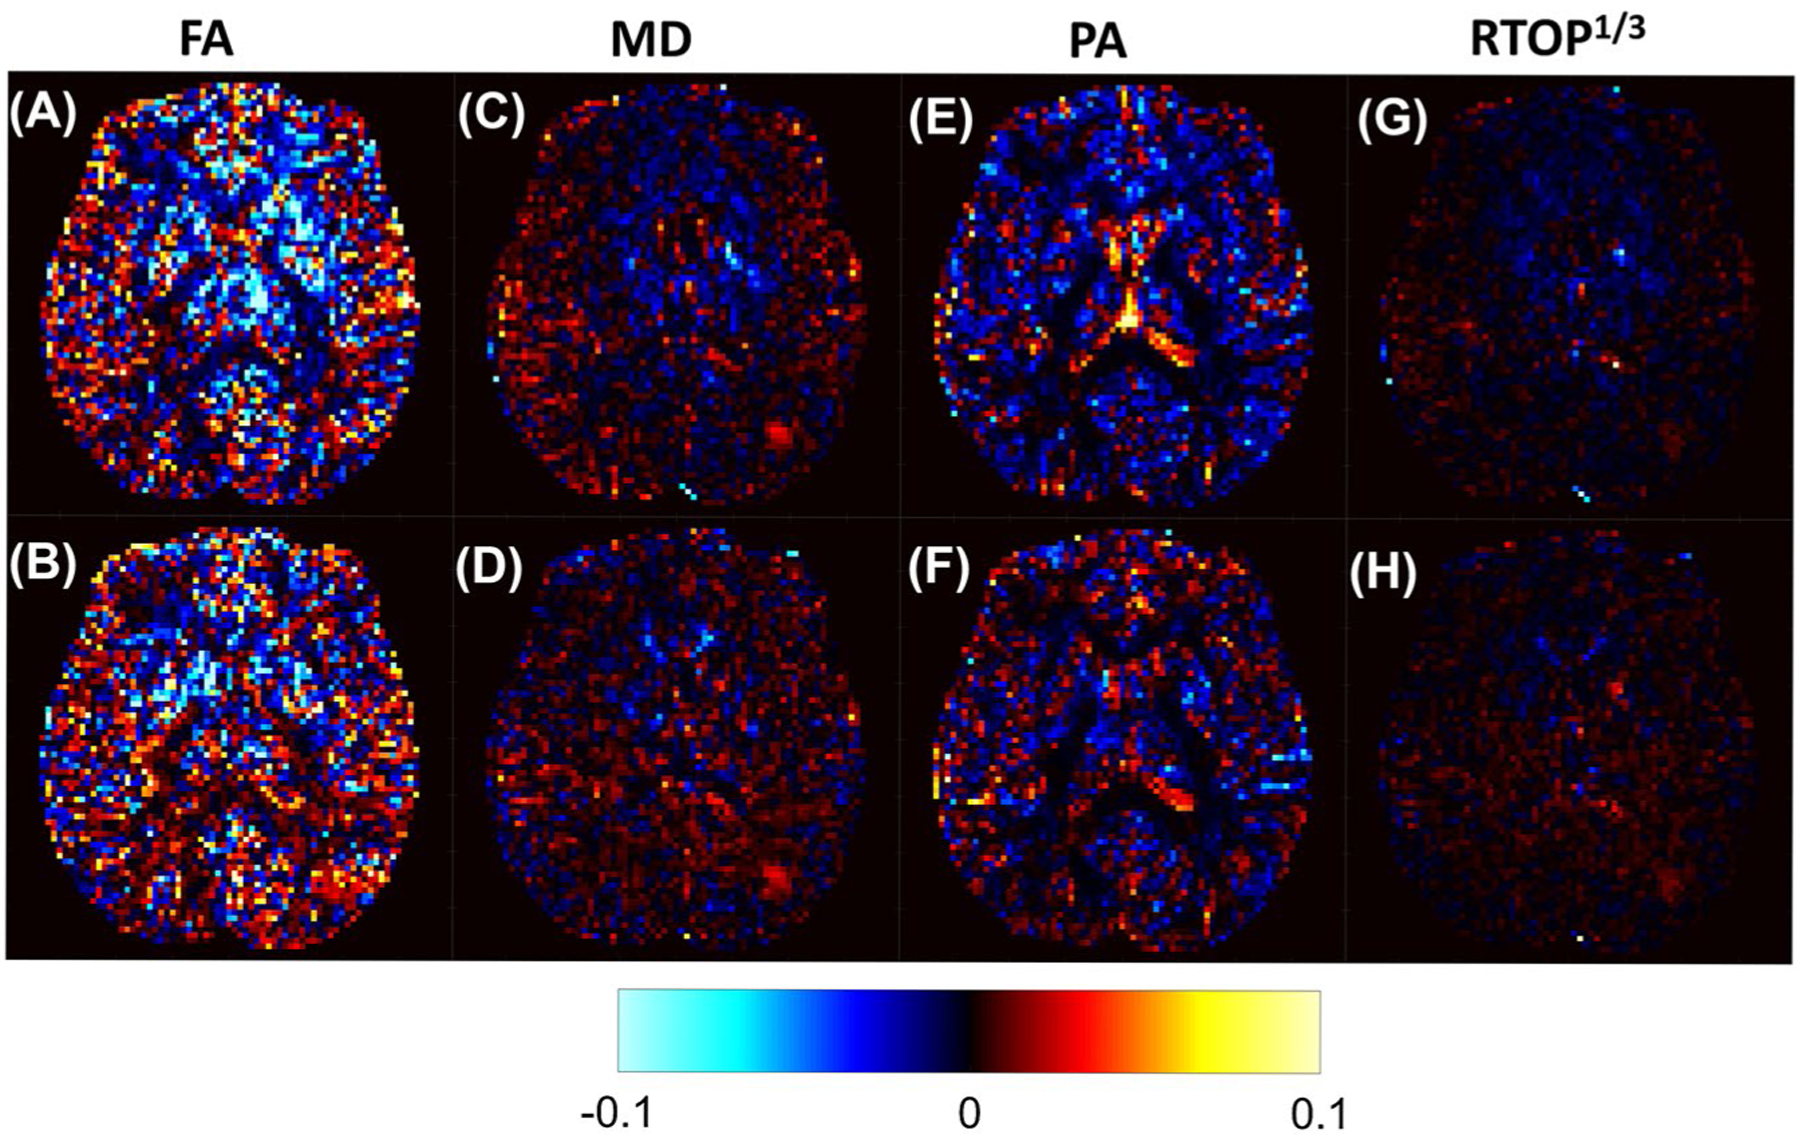
FIGURE 4.

Difference maps between the CVs of parameters derived from MB and SB acquisitions. The top row displays the CV of the short TR MB (TR = 3.7 seconds)–derived parameter values subtracted from the CV of the SB-derived parameter values. The bottom row shows the CV of the TR-matched MB (TR = 10.7 seconds)–derived parameter values subtracted from the CV of the SB-derived parameter values. All CV maps are plotted on the same scale, where red and yellow indicate that the MB CV is lower than the SB CV, and blue indicates that the MB CV is larger than the SB CV
