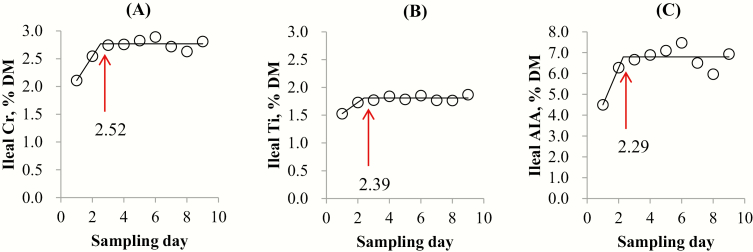
Figure 2.
Data points represent means of 9 sampling days from 8 pigs (initial BW = 58.1 kg) fed an N-free diet (1.9 kg/d). Each regression model shows the marker concentrations in ileal digesta samples from pigs (Y) relative to sampling day (X). (A) The linear broken-line model for ileal Cr concentration indicated that the breakpoint for ileal digesta Cr concentration was 2.52 d (SE = 0.60) based on the following equation: Y = 2.77 − 0.44 × (2.52 − X) where X is less than 2.52, with sum of squares of error = 12.86 and P = 0.001. (B) The linear broken-line model for ileal Ti concentration indicated that the breakpoint for ileal digesta Ti concentration was 2.39 d (SE = 0.51) based on the following equation: Y = 1.81 − 0.20 × (2.39 − X) where X is less than 2.39, with sum of squares of error = 2.48 and P = 0.002. (C) The linear broken-line model for ileal digesta acid insoluble ash (AIA) concentration indicated that the breakpoint for ileal digesta AIA concentration was 2.29 d (SE = 0.58) based on the following equation: Y = 6.80 − 1.78 × (2.29 − X) where X is less than 2.29, with sum of squares of error = 287.60 and P = 0.021.

