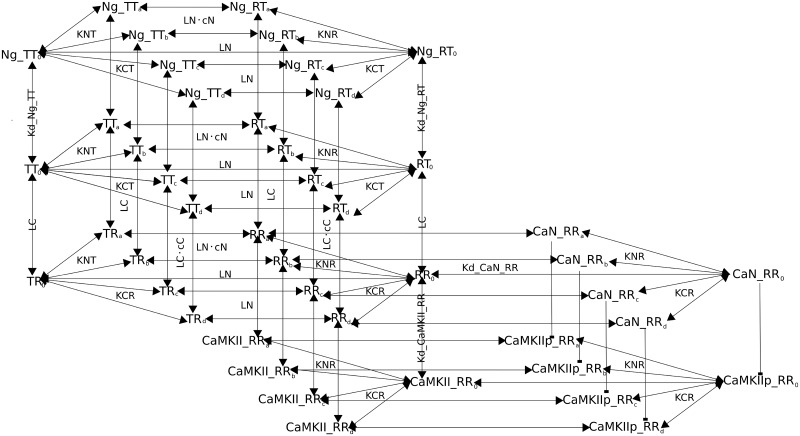
Fig 1. Reaction Diagram involving CaM and its binding partners.
Binding interactions and state transitions involving calcium, CaM and CaM-binding proteins. For simplicity, only the binding of the first calcium ion is included. The reactions shown here are applied to all other calcium-bound forms, with any combination of filled calcium-binding sites. a and b represents calcium binding on CaM N lobe; c and d represent calcium binding on the C lobe. R indicates open lobes; T closed lobes. Dissociation coefficients for calcium at specific binding sites are specified, as well as state transition constants (ratios between opposite state transition rates). Identical dissociation constants for protein binding CaM are only written once. Parameter values are included in Table 1.

