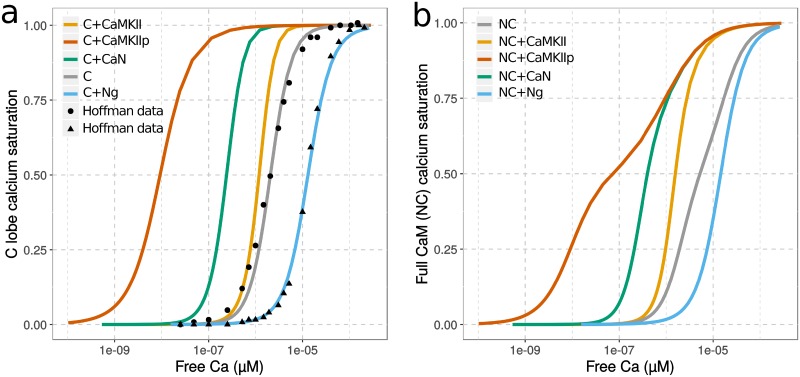
Fig 2. Saturation curves of CaM by calcium.
Values were obtained by scanning a range of initial calcium concentrations and running simulations until steady-state is reached, using initial conditions described in Hoffman et al. 2014 [26]. a) shows only the saturation of C lobe (within the context of the entire CaM) while b) shows the whole CaM, without any substrates (grey), with Ng (blue), non-phosphorylated CaMKII (orange), CaN (green) or Thr286-phospho-CaMKII (red). The x-axis shows the free concentration of calcium and not the initial concentration used for the scan. [CaM] = 5 μM; [Ng/CaMKII/CaMKIIp/CaN] = 50 μM. Solid line: simulation results; dots: experimental observations.

