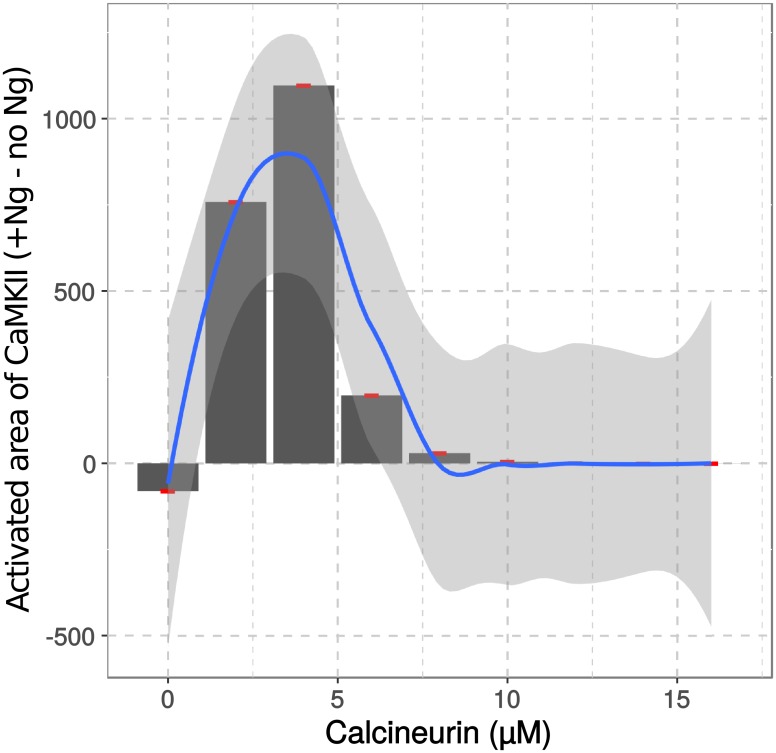
Fig 11. CaN concentration affects Ng regulation of CaMKII activation.
Different CaN concentrations were applied in the presence and absence of Ng. The difference between CaMKII’s activated areas reached in response to a 100 Hz calcium spike frequency in presence and absence of Ng were plotted against CaN concentration. The relationship was further fitted into a polynomial function (method loess() from ggplot2) and plotted as the blue line. Red points are the values coming from our simulations. Shaded light grey area represents the 95% confidence interval for the fitting.

