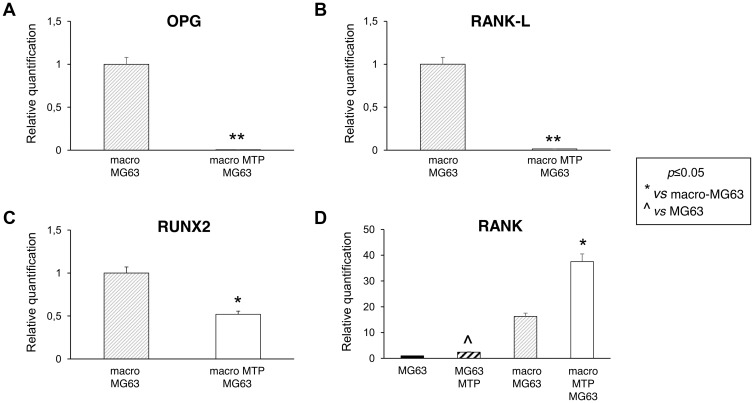
Figure 4. Effects of Mifamurtide (MTP) on bone metabolism markers in MG63 alone and co-cultured with macrophages.
(A–C) OPG, RANK-L, RUNX2 mRNA expression levels in MG63 co-cultured with macrophages activated or not with MTP [100 µM] determined by RT-qPCR. (D) RANK mRNA expression levels in MG63 alone or in co-culture with macrophages activated or not with MTP [100 µM] determined by RT-qPCR. Results were normalized for the housekeeping gene β-Actin and showed as mean ± SD of three independent experiments. A t-test has been used to evaluate statistical differences in mRNA expression levels. *indicates p ≤ 0.05 compared to macrophages-MG63 co-culture, **indicates p ≤ 0.01 compared to macrophages-MG63 co-culture, ^ indicates p ≤ 0.05 compared to MG63 alone.

