. 2020 Jan 6;9:e52291. doi: 10.7554/eLife.52291

Figure 3. Direct binding of exposed ER-trafficked protein sequences to the DR5 ECD is sufficient to induce oligomerization.

(A) A peptide array tiled with sequences from the ectodomain of myelin protein zero (MPZ) and extracellular loops from rhodopsin (RHO) was incubated with Fc-tagged DR5 ectodomain domain (long isoform, 500 nM). Signal was obtained by probing with anti-Fc. (B) Coomassie stained SDS-PAGE gel of pulldown on Fc-tagged DR5L ECD (55 kDa) or TNFR1 ECD (65 kDa) incubated with increasing concentrations of the MPZ-ectoVD peptide (apparent MW of 10 kDa, see 'Amino acid sequences of MPZ-derived peptides' for sequence). (C) Fluorescence quenching of AlexaFluor647-DR5L (green) or TNFR1 ECD (blue) was measured with increasing MPZ-ecto peptide to quantify the binding affinity, whereas quenching was not observed with the mutated MPZ-ectoTyr→Glu peptide (magenta) (N = 3, error bars are SD). DR5L ECD binds to the MPZ-ecto peptide with a K1/2 of 109 ± 11 μM with a hill coefficient of 2.6 ± 0.5. (D) SDS-PAGE of recombinant FLAG-tagged DR5L ECD (25 kDa, 10 μM) incubated with MPZ-ecto peptide at the noted concentrations and treated with the amine crosslinker BS3 (100 μM), probed with anti-FLAG. (E) Size exclusion chromatographs of absorbance at 280 nm for 25 μM recombinant DR5L ECD alone (black), pre-incubated with 100 μM fluorescein-conjugated MPZ-ecto peptide (green) or 100 μM fluorescein-conjugated MPZ-ectoTyr→Glu peptide (magenta). (F) SDS-PAGE gels scanned for fluorescence and then stained with Coomassie for eluted size exclusion fractions in (E). Green outlines (top pair) correspond to fractions from DR5L pre-incubated with MPZ-ecto peptide, and magenta outlines (bottom pair) correspond to DR5L with MPZ-ectoTyr→Glu peptide. Lane marked by “-“ denotes a blank lane between the input and 7 ml fraction to minimize spillover of signal from input sample. Arrowheads mark detectable peptide fluorescence in the indicated fractions.

Figure 3—source data 1. Sequences and quantification of peptides probed with Fc-DR5 ECD on the peptide array.
This excel file contains the peptide sequences of the peptide array shown in Figure 3A, the quantification of DR5 ECD detected for each spot, and the analysis for enriched amino acids in Figure 3—figure supplement 1.

Figure 3.

Figure 3—figure supplement 1. DR5 ECD binds to selective subset of sequences displayed by the secretory proteome.

Figure 3—figure supplement 1.

(A) Intensity values of each peptide spot in the MPZ section of the peptide array in Figure 3A were normalized to the spot of highest intensity within MPZ. Green box below denotes the peptide chosen as a candidate binder, called MPZ-ecto, shown in spots C18-C19 on the array. Sequences for the peptides are listed in Figure 3—source data 1. (B) Intensity values of the RHO peptide array section in Figure 3A normalized to the highest intensity from MPZ. Peptides were derived from the extracellular N-terminus tail and the extracellular loops (EL1-EL3) that connect the transmembrane domains of rhodopsin. (C) Quantification of enriched amino acids from peptides with an intensity value greater than one standard deviation above the average signal, noted as a preferred peptide, within the entire array. Enrichment ratio for each amino acid was calculated as the frequency of occurrence in preferred peptides divided by its total frequency on the array.
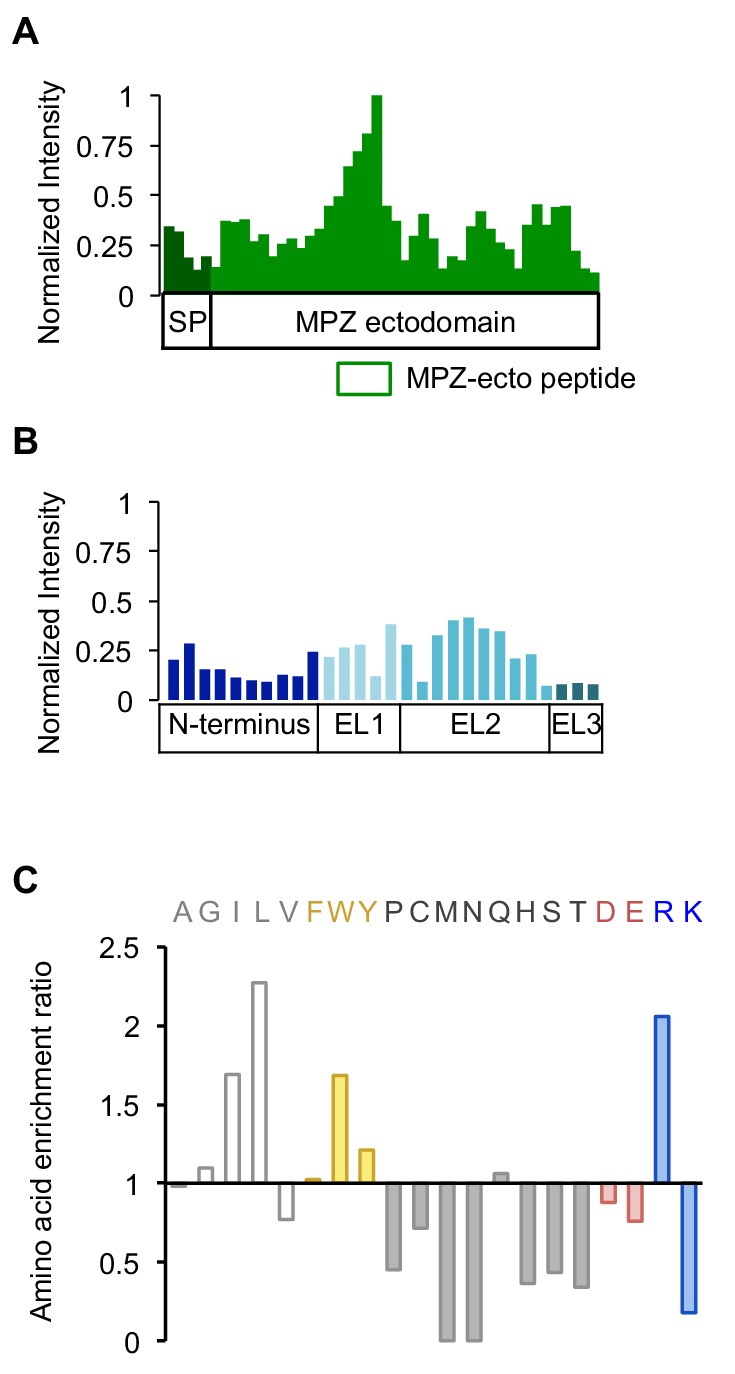
Figure 3—figure supplement 2. Purified recombinant DR5 ECD oligomerizes with peptide in a specific and reversible manner.

Figure 3—figure supplement 2.

(A) Fluorescence scan at 647 nm of SDS-PAGE for gel filtration-purified DR5L (25 kDa) or TNFR1 ECD (35 kDa) labeled with NHS-ester AlexaFluor647. These proteins were used in the fluorescence quenching assays shown in Figure 3C. (B) Fluorescence de-quenching of AlexaFluor647-DR5L ECD (200 nM) pre-incubated with 100 μM or 200 μM of MPZ-ecto peptide in the presence of increasing concentrations of unlabeled DR5L ECD. (C) Coomassie-stained SDS-PAGE of gel filtration purified FLAG-tagged DR5L ECD proteins used for the crosslinking assay in Figure 3D and size exclusion chromatography in Figure 3E. (D) Size exclusion chromatographs of absorbance at 280 nm for recombinant DR5L ECD to show that increased concentration of DR5L alone does not yield multimers. (E) Size exclusion chromatographs of absorbance at 280 nm for recombinant DR5L ECD alone (25 μM, black) or incubated with TRAIL (25 uM, purple). Trace for TRAIL alone (50 μM) is shown in light orange. (F) SDS-PAGE gels stained with Coomassie blue for eluted size exclusion fractions in Figure 3—figure supplement 2E depicting bands for DR5L ECD and TRAIL. (G) Size exclusion chromatographs of absorbance at 280 nm for 25 μM recombinant DR5L ECD alone (black), pre-incubated with 400 μM fluorescein-conjugated MPZ-ecto peptide (teal). (H) SDS-PAGE gels scanned for fluorescence and then stained with Coomassie for eluted size exclusion fractions in Figure 3—figure supplement 2G. Lane marked by “-“ denotes a blank lane between the input and 7 ml fraction to minimize spillover of signal from input sample. Arrowheads mark detectable peptide fluorescence in the indicated fractions.