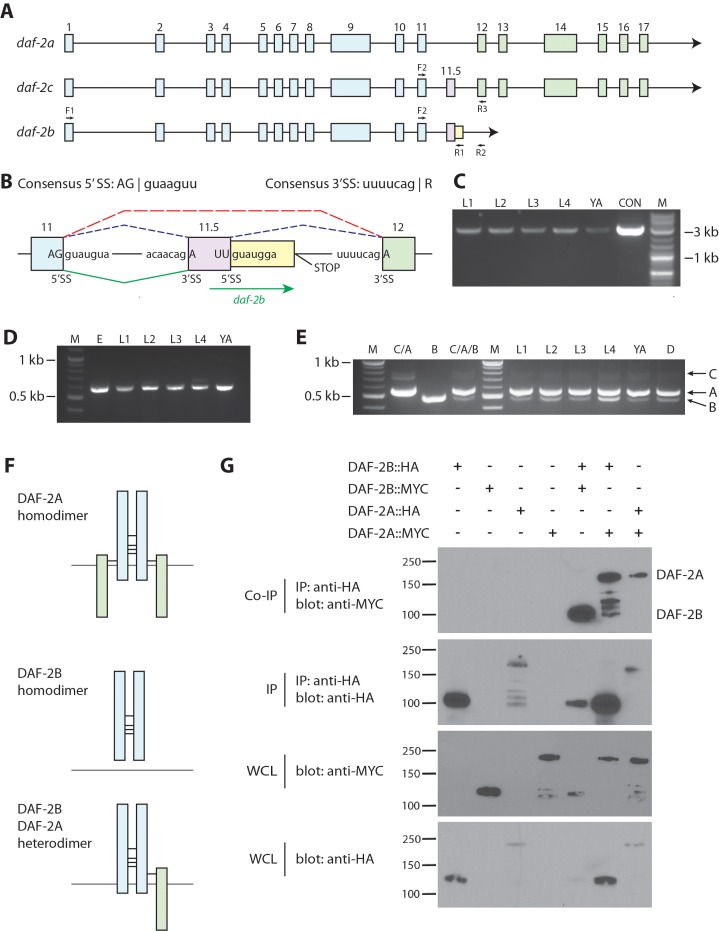
Figure 1. daf-2b encodes a truncated insulin receptor that is capable of dimerization.
(A) Genomic organization of the daf-2 locus. Exons shaded in blue encode the α subunit (extracellular domain) and those in green encode the β subunit (transmembrane and tyrosine kinase domains). The alternate cassette exon utilized in daf-2c (exon 11.5) is shown in pink. The daf-2b transcript is predicted to arise if splicing at the exon 11.5 5’SS is skipped leading to the addition of 46 bp of intronic sequence (shown in yellow) before an in-frame stop codon is reached. F1, F2, R1, R2 and R3 indicate the location of primers used in cDNA amplification. (B) Details of the daf-2 genomic locus from exon 11 to exon 12. The sequence of 5’ and 3’ splice sites (SS) are indicated. Dotted lines indicate splicing events for daf-2a (red) and daf-2c (blue). Green solid lines indicate splicing events for generation of the daf-2b transcript. (C) PCR amplification of full-length daf-2b cDNA using primers F1 and R1 (panel A). M - molecular weight markers, L – larval stage, YA – young adults, CON – daf-2b cDNA from plasmid template. (D) PCR amplification of a daf-2b cDNA fragment encompassing exon 11 and the predicted 3’ UTR using primers F2 and R2 (panel A). M - molecular weight markers, E – embryos, L – larval stage, YA – young adults. (E) Multiplex PCR of daf-2a, daf-2b and daf-2c from pooled cDNA (lanes marked C/A, B and C/A/B) and larval stages including dauer (D) using primers F2, R1 and R3 (panel A). (F) Schematic illustrating the possible formation of DAF-2A and DAF-2B homodimers and DAF-2A/DAF-2B heterodimers via formation of disulfide bonds at conserved cysteine residues. (G) Coimmunoprecipitation of epitope tagged DAF-2A and DAF-2B indicates the capacity to dimerize. Immunoprecipitates were subjected to SDS PAGE and blotted with anti-MYC (top panel) and anti-HA (second panel). Whole cell lysates (WCL) were blotted with anti-MYC and anti-HA (bottom two panels). Coimmunoprecipitation data are representative of 3 independent experiments.
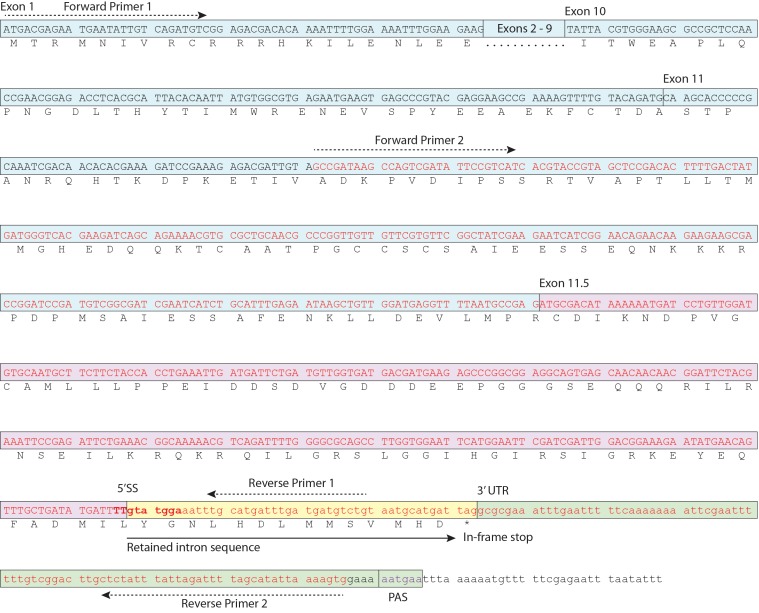
Figure 1—figure supplement 1. Schematic of daf-2b cDNA.
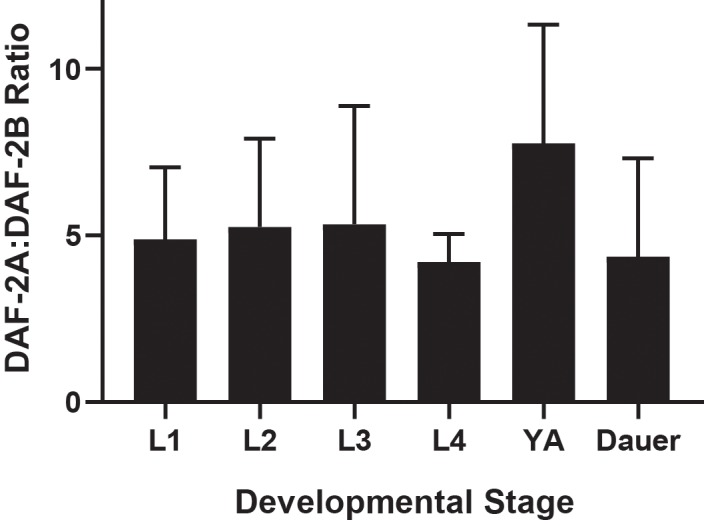
Figure 1—figure supplement 2. Ratio of daf-2a to daf-2b.


