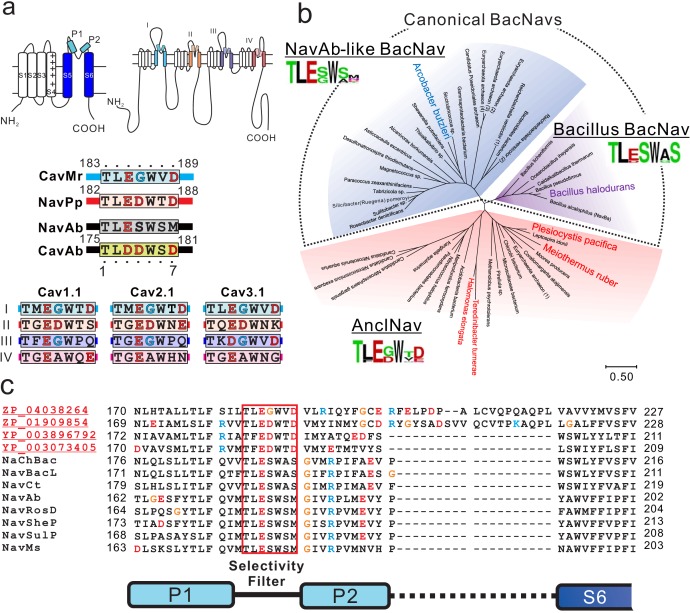
Figure 1. Sequence analysis of ancestor-like BacNavs.
(a) Schematic secondary structure and selectivity filter sequence of BacNavs and 24TM channels. A cylinder indicates an α-helix. The selectivity filter sequences are indicated using single-letter codes. Negatively charged residues are colored in red. Glycine residues in the position four are colored in cyan. The straight lines indicate the other parts of the pore domain. The selectivity filter sequences of hCav1.1 (UniProt ID: Q13698), hCav2.1 (O00555) and hCav3.1 (O43497) were used. (b) Phylogenetic tree of canonical BacNavs and ancestor-like BacNavs (AnclNavs). The MUSCLE program was used to align the multiple protein sequences of the channels (Figure 1—source data 1). The phylogenetic tree was generated using MEGA X. The branch lengths are proportional to the sequence divergence, with the scale bar corresponding to 0.5 substitutions per amino acid position. Three phylogenetically distinct groups are shown in different background colors (purple, Bacillus BacNavs; blue, NavAb-like BacNavs; red, AnclNavs). Four homologs with the taxon name colored in red in the AnclNav group were cloned and expressed to check the channel activity. Two of those, which are shown in larger and bold text, generated the detectable currents. The appearance frequency of amino acids in each of the selectivity filter sequences is shown under the respective group names. (c) Alignment of the deduced amino-acid sequences of the P1 helix to P2 helix domain of novel cloned homologs of AnclNavs with well characterized BacNavs.


