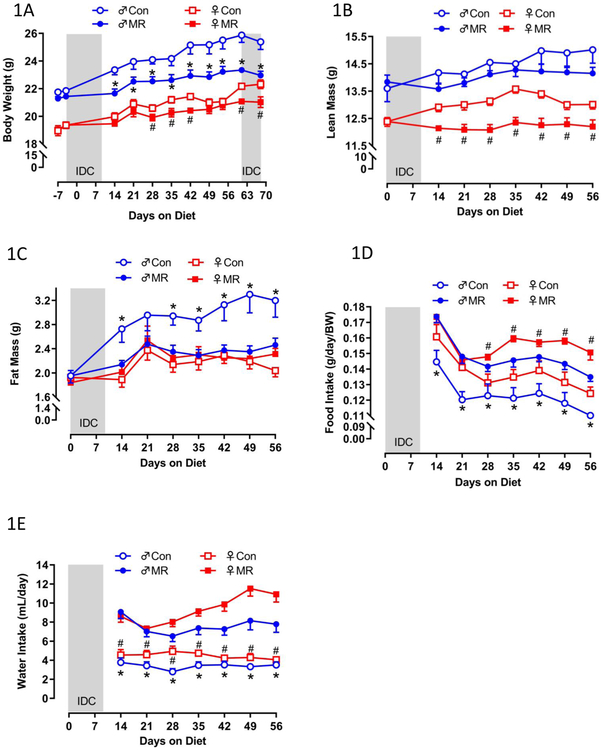
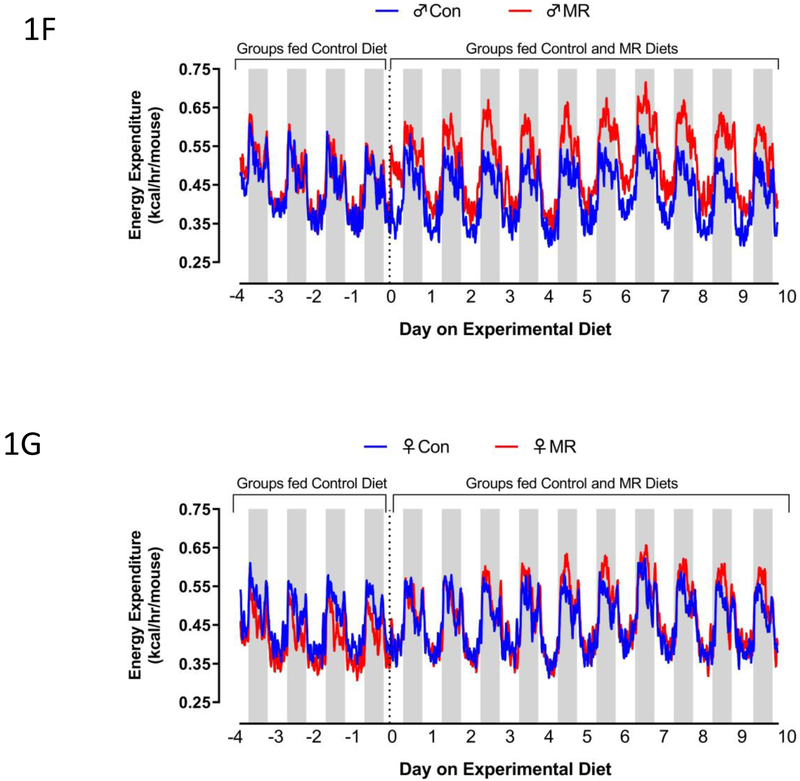
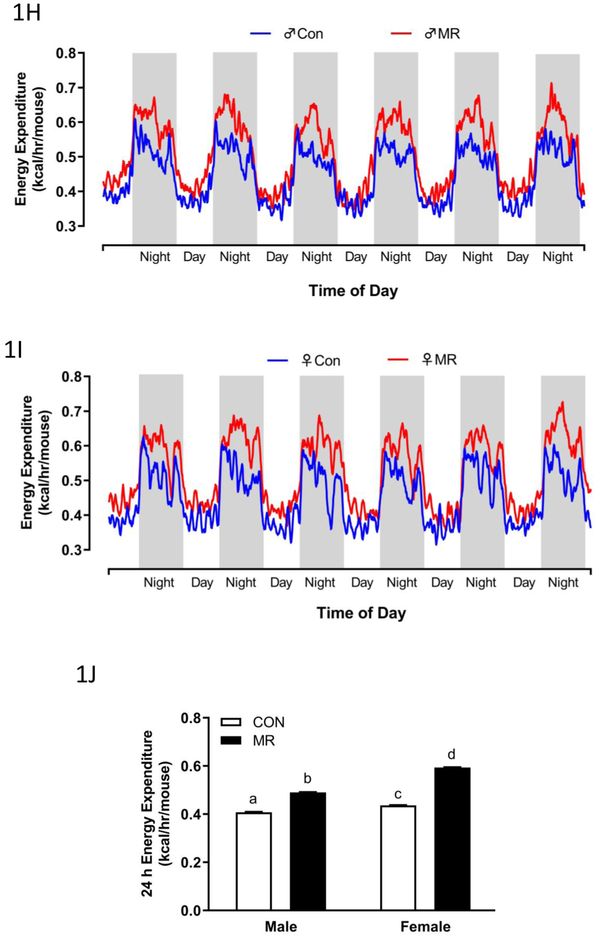
Figure 1 – Energy Balance Data for Experiment 1.
Body weight (A), lean mass (B) fat mass (C) food intake (D), and water intake (E) were measured at weekly intervals over the course of the 8 week study and analyzed using a repeated measures two way ANOVA with sex and diet as main effects. Means at specific time points that are annotated with an asterisk (*) differ between Con and MR for male mice at p < 0.05 or annotated with a pound symbol (#) differ between Con and MR for female mice at p < 0.05. Energy expenditure (EE) was measured via indirect calorimetry (IDC) during the first 10 days of the experiment (F-males,G-females) and for the last 7 days of the experiment (H-males, I-females). Error bars are omitted for clarity in Figs. 1F-1I. Prior to beginning the experiment, 16 animals of each sex were placed in the calorimeter chambers for 4 days with all animals receiving the control diet. Then on day 0, half the mice of each sex were switched to the MR diet while the other half of the mice continued on the control diet. EE was measured for the next 10 days. At the end of the study, all mice were returned to the calorimeter chambers for measurement of EE for 6 days. The time courses of EE means are summarized in Fig. 1H for males and Fig. 1I for females The time periods the mice were in the calorimeter chambers is designated with grey bars in Figs. 1A-1E. Mean 24 h EE was calculated from the measurements made during the last week of the study and compared by ANCOVA (J). All values are expressed as mean ± SEM for 8 mice of each diet x sex. In Fig. 1J, the least square means for 24 h EEnot sharing a common letter differ at p < 0.05.


