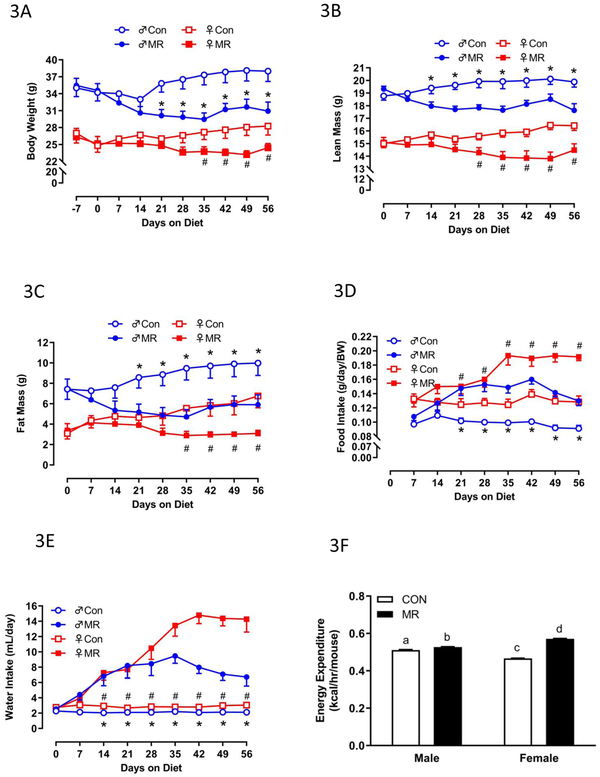
Figure 3 – Energy Balance Data for Experiment 2.
Body weight (A), lean mass (B) fat mass (C) food intake (D), and water intake (E) were measured for 8 mice of each diet x sex combination at weekly intervals over the course of the 8 week study and analyzed using a repeated measures two way ANOVA with sex and diet as main effects. Means at specific time points denoted with an asterisk (*) differ between Con and MR for male mice at p < 0.05 and denoted with a pound symbol (#) differ between Con and MR for female mice at p < 0.05. . Energy expenditure (EE) was measured via indirect calorimetry (IDC) during the last 4 days of the experiment. Least squares means for 24 h EE were calculated from the measurements made during the last week of the study by ANCOVA (F). For 24 h EE, groups not sharing a common letter differ at p < 0.05.

