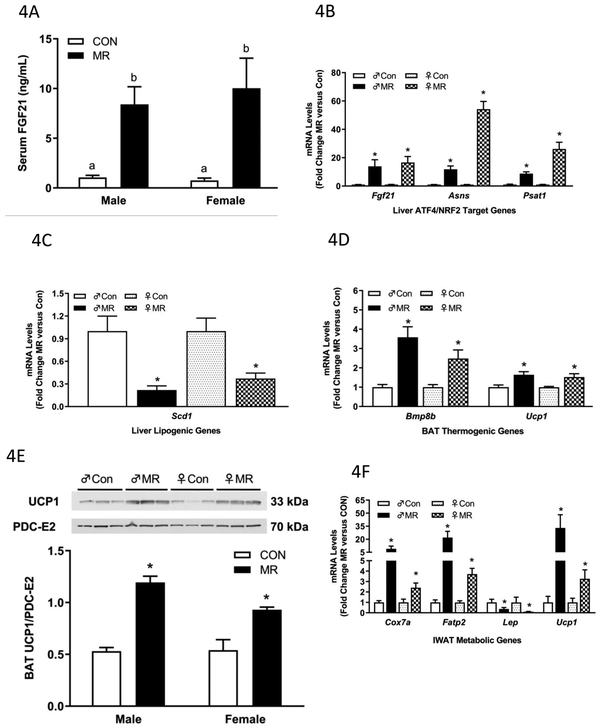
Figure 4 – Endocrine and Transcriptional Endpoints for Experiment 1.
Serum FGF21 (A) in blood samples collected at end of study. Hepatic gene expression (B,C), brown adipose tissue gene expression (D), and inguinal white adipose tissue (F) gene expression was measured via qPCR or by Western blot (E) for UCP1 expression in brown adipose tissue. The mitochondrial marker, PDC-E2 (pyruvate dehydrogenase dihydrolipoamide acetyltransferase) was used as a loading control for the UCP1 Western blot. Serum FGF21 was measured via ELISA. Con – control; MR – methionine restricted diets; IWAT – inguinal white adipose tissue; BAT – brown adipose tissue; Fgf21 – fibroblast growth factor 21; Asns – asparagine synthase; Psat1 – Phosphoserine Aminotransferase 1; Scd1 – stearoyl CoA desaturase 1; Bmp8b – bone morphogenetic protein 8b; Ucp1 – uncoupling protein 1; Cox7a – cytochrome C oxidase subunit 7A; Lep – Leptin; Fatp2 – fatty acid transport protein 2. Each variable was analyzed using a two way ANOVA with sex and diet as main effects and residual variance used as the error term. All values are expressed as mean ± SEM for 8 mice of each diet x sex. Means for fold-change of gene expression denoted with an asterisk (*) indicates significant difference from Con at p < 0.05. For serum FGF21, means not sharing a common letter differ at p < 0.05.

