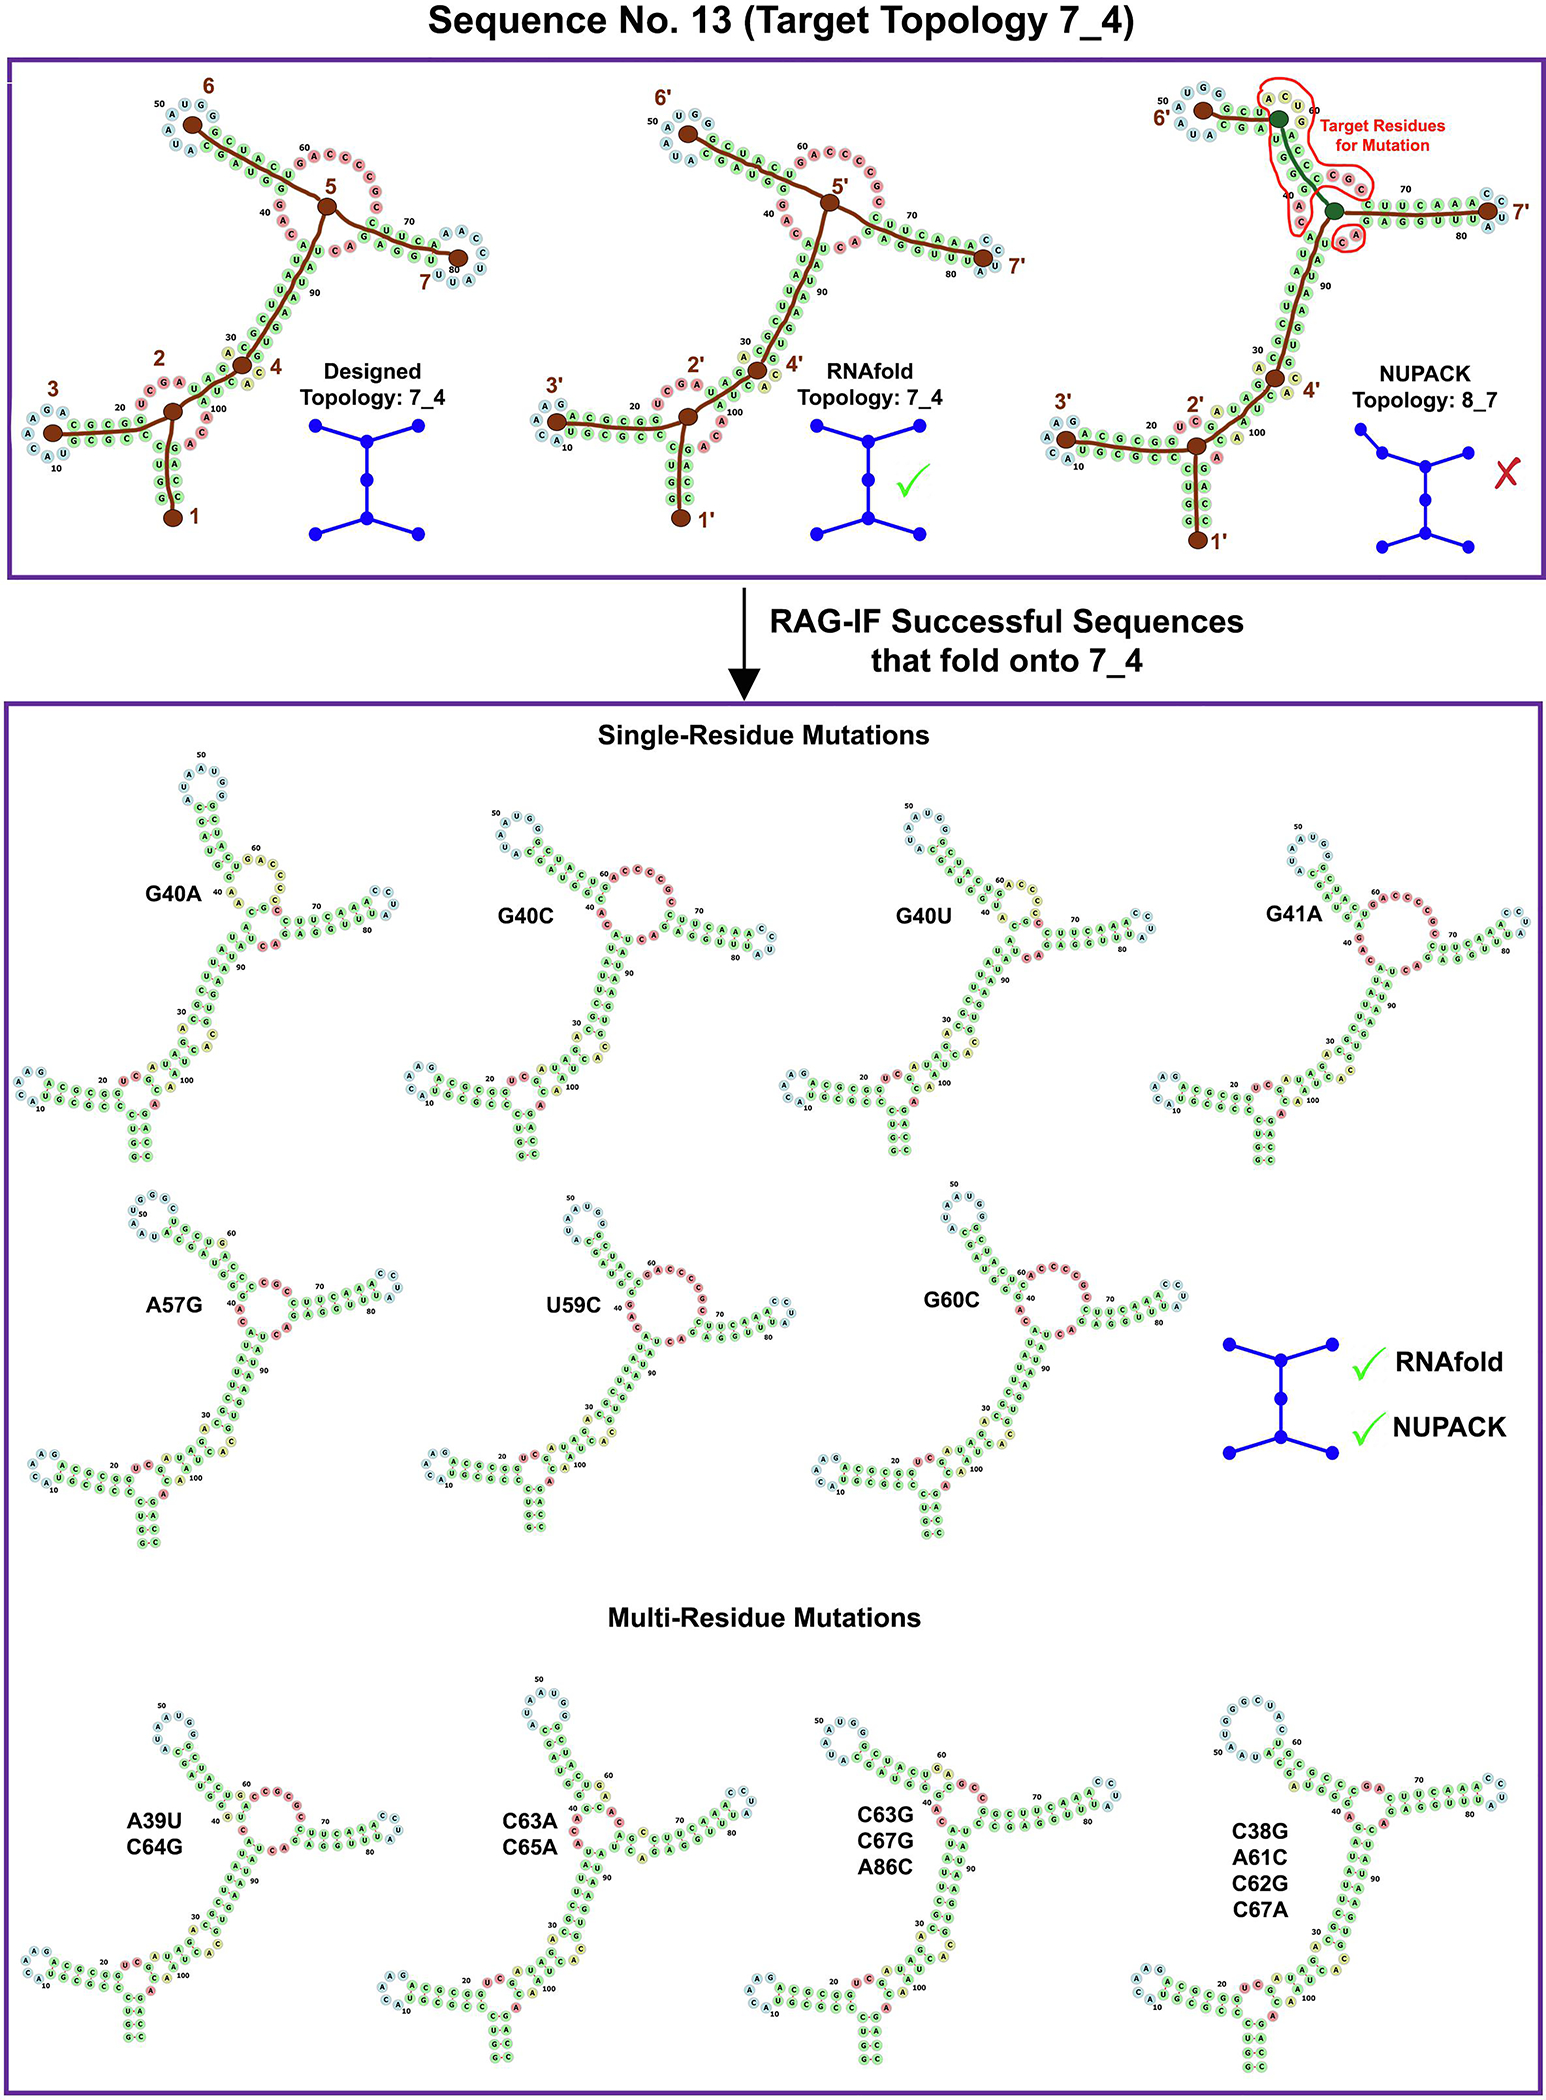
Fig. 4.

Images for RAG-IF 7_4 design. The designed (7_4), RNAfold predicted (7_4) and NUPACK predicted (8_7) tree graph topology for a sample starting sequence (sequence 13 for 7_4 topology in Figure 10). Brown vertices are correlated (labeled as n and n′), while the green vertices are uncorrelated. Residues selected for mutation are enclosed within the red curve. Also shown are all optimal sequences generated from this starting sequence, with single and multi residue mutations grouped separately. The shown 2D structures of the successful sequences was predicted with NUPACK.
