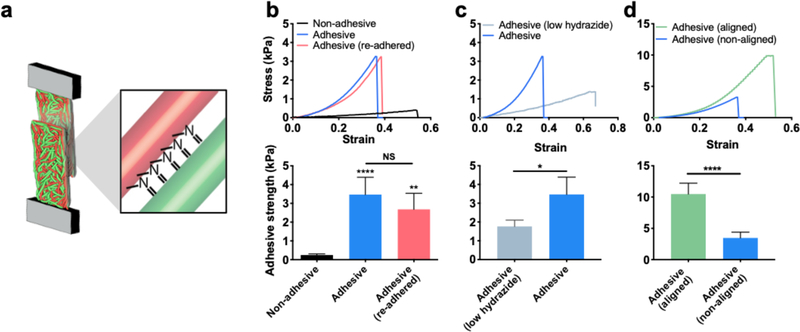
Figure 4.
Interfacial bonding with adhesive fibers. (a) Schematic of interfacial bonding between layers of adhesive fibers assessed with tensile loading. (b) Representative stress strain curves during interfacial adhesion testing (top) and average adhesive strength (bottom) of non-adhesive (black), adhesive (blue), and adhesive fibers that have been re-adhered after one cycle of adhering and breaking adhesion (pink). (c) Representative stress strain curves during interfacial adhesion testing (top) and average adhesive strength (bottom) of adhesive fibers with low hydrazide concentration (light blue, 20% of original hydrazide) and adhesive fibers (blue) from panel (b) for comparison. (d) Representative stress strain curves during interfacial adhesion testing (top) and average adhesive strength (bottom) of aligned adhesive fibers (green), and adhesive fibers (blue) from panel (b) for comparison. One-way ANOVA and Tukey post hoc test across all conditions was used to test for significance. *,**,**** represent p≤0.05, p≤0.01, p≤0.0001.

