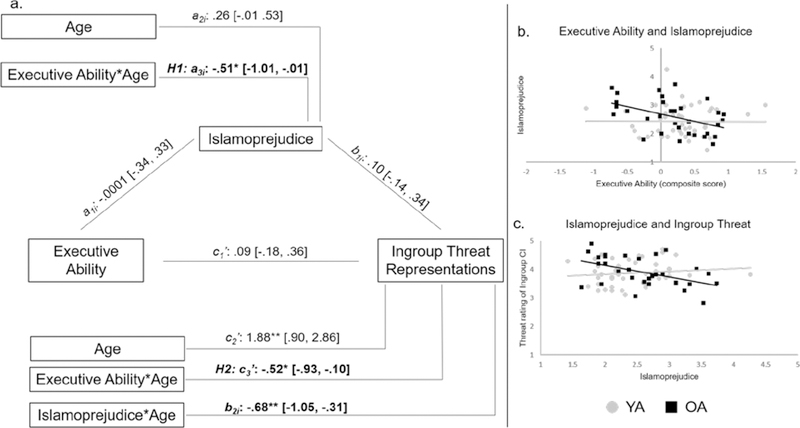
Figure 4.

Coefficients from the model predicting ingroup threat representations from executive ability, Islamoprejudice, and moderation of these factors by Age Group (a). Coefficients supporting the hypotheses that OA’ executive ability would negatively relate to their Islamoprejudice (path a3i), that OA’ executive ability would negatively relate to their ingroup threat representations (path c3’) and that OA’ Islamoprejudice would negatively relate to their ingroup threat representations (path b2i) are in bold. Numbers in brackets are 95% confidence intervals of the coefficients. Scatterplots show that the relationships between OA’ executive ability and Islamoprejudice (b) and OA’ Islamoprejudice and their ingroup threat representations (c) were not outlier-driven.”*p<.05 **p<.01
