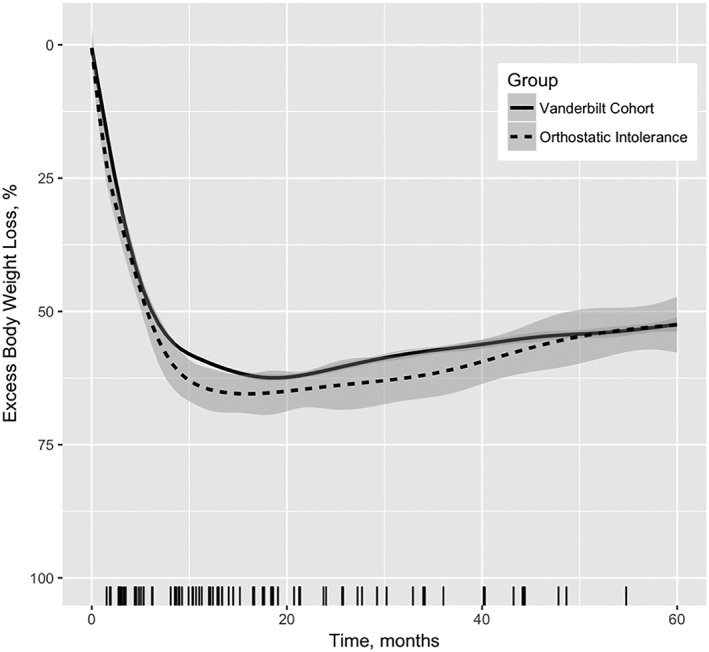
Figure 2.

Mean excess body weight loss 5 years post operation of orthostatic intolerance (OI) patients vs all Vanderbilt bariatric surgery population. Shaded area indicates 95% confidence interval of the mean. Each tick on X‐axis indicates unique time of OI onset per patient
