
Figure 1.
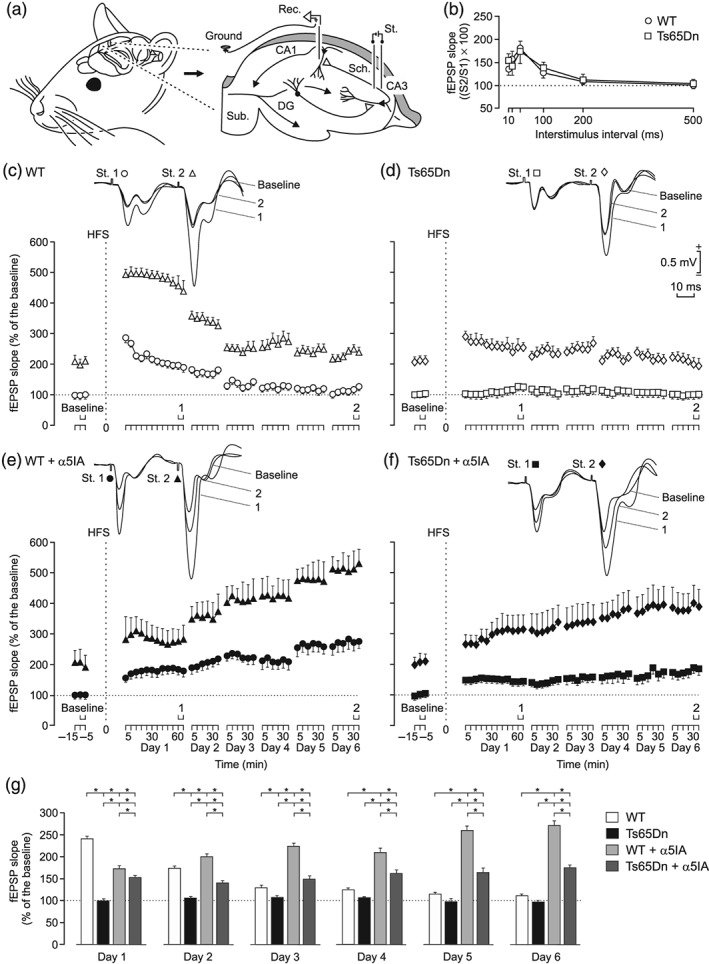
In vivo LTP deficits found at the CA3‐CA1 synapses of the hippocampus in Ts65Dn mice are sustainably reversed by a single injection of α5IA, a NAM of the α5‐containing GABAA receptors. (a) Schematic diagram of the experimental design. Mice were chronically implanted with stimulating (St.) electrodes on Schaffer collaterals (Sch.) and with a recording (Rec.) electrode in the ipsilateral CA1 area of the hippocampus. An extra electrode was attached to the bone as ground. (b) Paired‐pulse facilitation evoked in WT and Ts65Dn mice at increasing time intervals. Note that peak facilitation took place at an interval of 40 ms. No significant differences were observed between the two groups of mice. (c, d) Upper traces are representative examples of field EPSPs (fEPSPs; averaged five times) collected from selected (c) WT and (d) Ts65Dn mice evoked by paired pulses (40 ms of interpulse intervals) presented to the CA3‐CA1 synapse. fEPSPs were collected before (baseline) and after the high frequency stimulation (HFS) of Schaffer collaterals at the indicated times (see 1 and 2 in the X axis). Lower graphs illustrate the time course of LTP evoked in the CA1 area (fEPSP mean ± SEM) by the paired pulses presented to Shaffer collaterals following HFS for (c) WT and (d) Ts65Dn mice. The HFS was presented after 15 min of baseline recordings, at the time marked by the dashed line. fEPSPs are given as the percentage of the baseline (100%) slope. Effects of HFS on fEPSPs evoked by the first (white circles in panel c and white squares in panel d) and second (white triangles in panel b and white diamonds in panel c) pulses are illustrated. Note that only WT mice presented a significant increase in fEPSP slopes following HFS when compared with baseline records. In addition, values collected from the WT group were significantly larger than those collected from Ts65Dn mice. (d, e) Data collected from (e) WT and (f) Ts65Dn mice following α5IA administration (5 mg· kg−1, i.p.). The effects of HFS on fEPSPs evoked by the first (black circles in panel e and black squares in panel f) and second (black triangles in panel e and black diamonds in panel f) pulses are illustrated. Note that α5IA facilitates the induction of LTP in control and Ts65Dn mice and that LTP was sustained in both groups of mice for at least 6 days. (g) Comparative analysis of fEPSP slopes (mean ± SEM) evoked by the first pulses in the four experimental groups. * P < .05, significantly different as indicated; ANOVA, two‐tailed. DG, dentate gyrus; Sub, subiculum