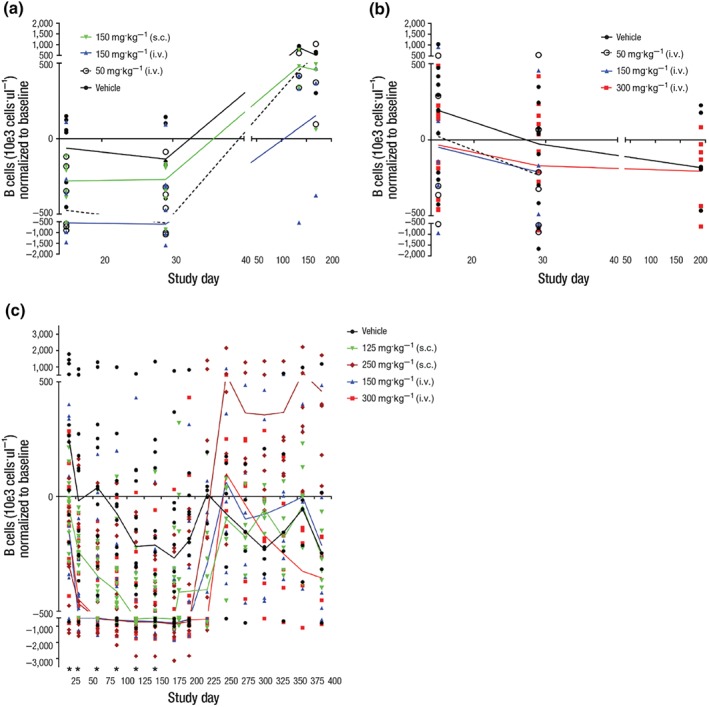
Figure 2.

The change over time in B‐cell count for individual animals treated with vehicle or VIB4920: (a) Study 1, five weekly doses of vehicle, VIB4920 at 5, 50, 150 mg·kg−1 i.v., 150 mg·kg−1 s.c. (for all groups, dosing phase N = 6, recovery phase N = 3); (b) Study 2, five weekly doses of vehicle, VIB4920 at 50, 150, 300 mg·kg−1 i.v. (for vehicle and 300 mg·kg−1 groups, dosing phase N = 12, recovery phase N = 6; for 50 and 150 mg·kg−1 groups, dosing phase N = 6, recovery phase N = 3); (c) Study 3, 28 weekly doses of vehicle, VIB 4920 at 150, 300 mg·kg−1 i.v., 125, 250 mg·kg−1 s.c. (for all groups, dosing phase N = 12, recovery phase N = 6). The line represents the median for each group. *P ≤ .05, significantly different from vehicle group; one‐way ANOVA with Dunnetts multiple comparisons test with a single pooled variance or Kruskal–Wallis test with Dunns multiple comparisons test or Mann–Whitney test. i.v., intravenous; s.c., subcutaneous
