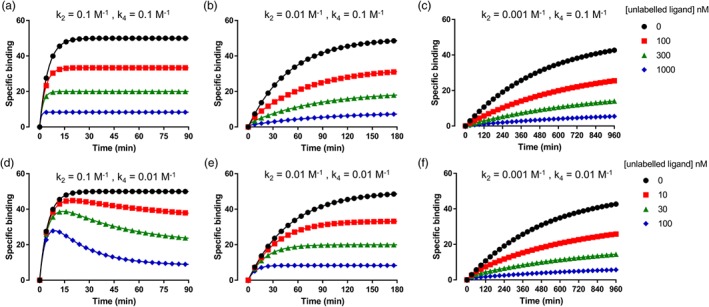
Figure 3.

Simulated competition association binding curves with increasing k off values of the labelled ligand simulations were generated in GraphPad Prism using the Motulsky and Mahan equation. k on (both k 1 and k 3) was set to 1 × 10⁶ M−1·min−1 for all simulated data (see Bosma et al., 2019, for full equation on the Motulsky–Mahan model). For (a, d), k off (M−1) of the labelled ligand (k 2) was set to 0.1, (b, e) to 0.01, and (c, f) to 0.001, simulating a 10‐fold increase in k off each time and a “fast,” “slow,” and “very slow” labelled ligand. The concentration of labelled ligand (L) was set to the K D of each ligand (100 nM for a and d, 10 nM for b and e, and 1 nM for c and f). For (a–c), k off of the unlabelled ligand (k 4) was set to 0.1, and for (d‐f), it was set to 0.01, simulating an unlabelled ligand with a “fast” and “slow” k off. The concentration of the unlabelled ligand was set to 1, 3, and 10 times its K D (100, 300, and 1,000 nM for a–c and 10, 30, and 100 nM for d‐f). In (d), the classic “overshoot” of an unlabelled ligand with a slower k off than the labelled ligand can be observed, whereas when a labelled ligand with a slower k off value is used, it becomes more difficult to distinguish between “slow” and “fast” unlabelled ligand
