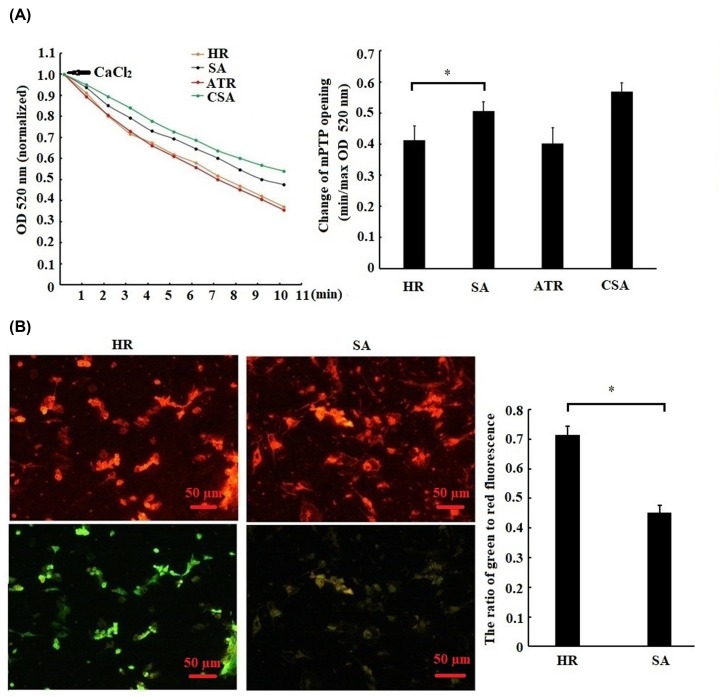
Figure 3. Sappanone A (SA) pretreatment repressed mPTP opening and release of mitochondrial transmembrane potential (ΔΨm).
Mitochondrial apoptosis pathway. H9c2 cardiomyocytes were treated by 25 µM SA for 1 h, followed by 6 h of hypoxia/3 h of reoxygenation. (A) mPTP opening was induced by CaCl2. Minimum optical density (min OD) represents the OD value recorded at the onset of the experiment (0 min); maximum optical density (max OD) represents the OD value recorded at the end of the experiment (10 min). Min/max OD is negatively associated with the extent of mPTP opening. CSA, cardiomyocytes treated with 0.2 mM cyclosporin a (a mPTP opening inhibitor) was used as a positive control. ATR, cardiomyocytes treated with 20 μM atractyloside (a mPTP opener) was used as a positive control. (B) Measurement of the level of ΔΨm. The level of ΔΨm was quantified by the ratio of green-to-red fluorescence intensity. Magnification: ×400, scale bars: 50 μm. Data are presented as the mean ± standard deviation from three independent experiments; * P < 0.05.

