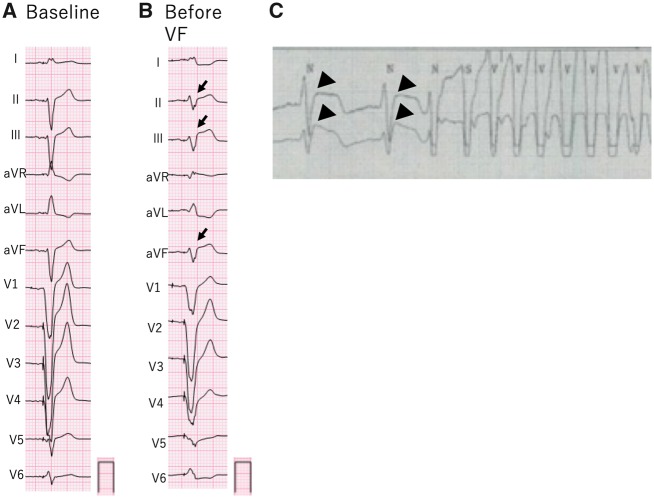
Figure 2.
(A) At baseline, electrocardiogram was obtained during right ventricular stimulation. (B) Electrocardiogram obtained just before ventricular fibrillation showed ST-elevation in the inferior leads and reciprocated ST depression in leads I, aVL, and V6 (arrows). (C) Before the onset of ventricular tachycardia, monitoring electrocardiogram showed marked ST elevation (broad arrows).

