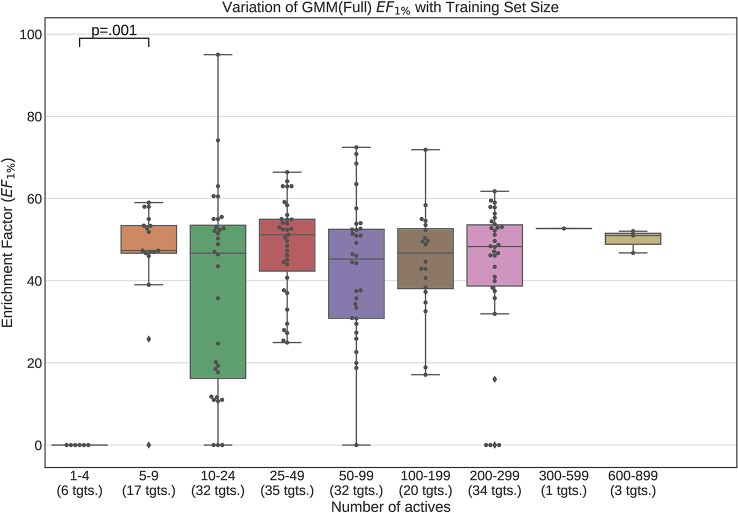
Figure 12.
Performance variation of full-conformer model Gaussian Mixture Models with number of actives. Scatter plot indicates one point per template within the given range. The number of templates captured within the range is indicated in the axis labels. Note that multiple points belonging to the same target could fall within a single range due to the binning thresholds used.

