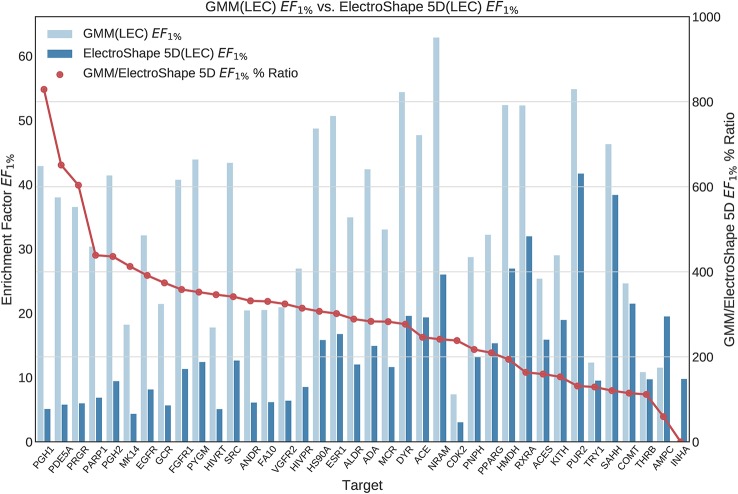
Figure 6.
Comparison of Enrichment Factor at 1% obtained by Gaussian Mixture Model with that obtained by ElectroShape 5D using Lowest Energy Conformers. Also plotted is the percentage ratio of the Enrichment Factor score of Gaussian Mixture Model (GMM) compared to ElectroShape 5D. Mean ratio = 291% ± 162%, max = 829%, min = 0%.

