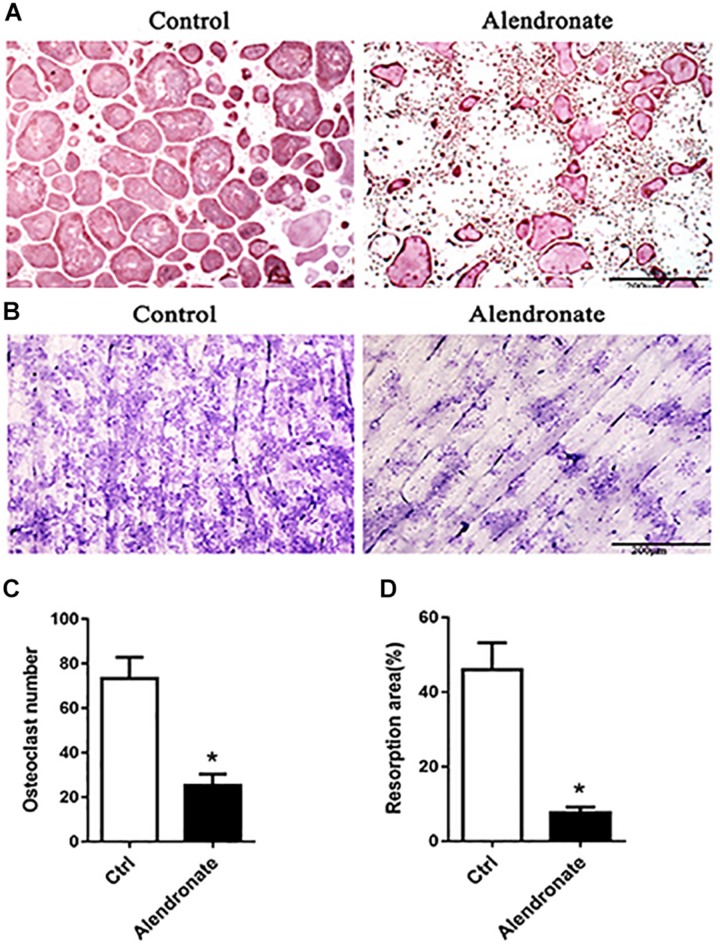
FIGURE 2.
The effect of alendronate treatment to osteoclast formation and its bone resorption efficiency. (A) TRAP + osteoclast cells stained in purple-red (TRAP staining, 5×). (B) Bone resorption lacunae stained in purplish blue patches (Toluidine Blue staining, 5×). (C) Bar chart of the effect of alendronate treatment to osteoclast number. *P < 0.001 vs. control group. (D) Bar chart of alendronate treatment to osteoclast bone resorption. *P < 0.001 vs. control group.

