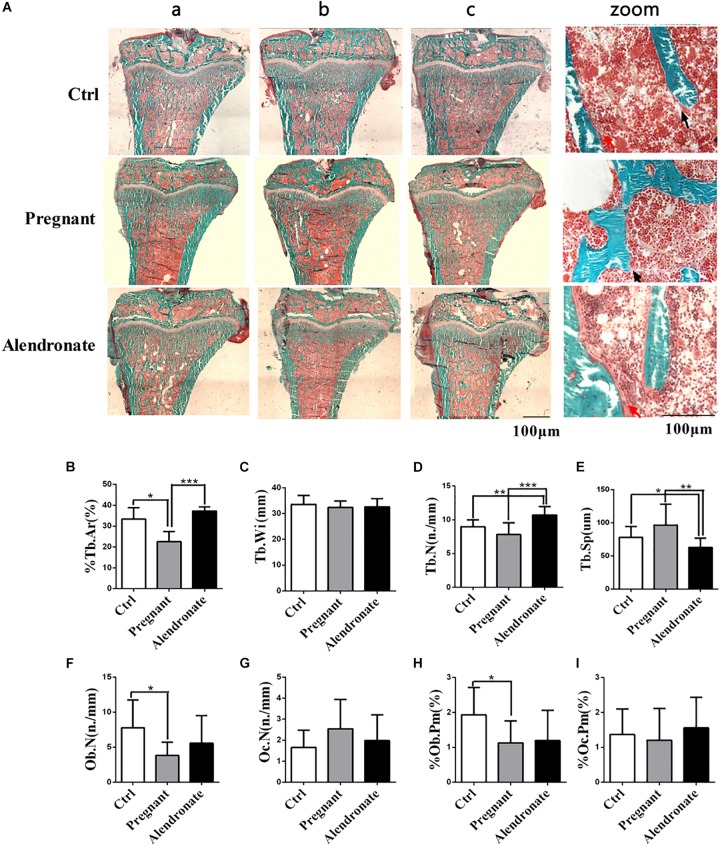
FIGURE 4.
Group comparisons in static parameters of maternal rats PTM. (A) Longitudinal un-decalcify sections of rat tibia epiphysis with Masson–Goldner Trichrome staining. (a–c) Representative images from different animals in the same treatment group. (Zoom) Higher magnification images of rat tibia epiphysis. The area stained in red is medullary region, area in green is trabecular region and compact bone mass; red arrow indicates osteoblast, while black arrow indicates osteoclasts respectively. (B–I) Static parameters of PTM. *P < 0.05, **P < 0.01, ***P < 0.001 (%Tb.Ar, trabecular area; Tb.Wi, trabecular width; Tb.N, trabecular number; Tb.Sp, trabecular separation; Ob.N, osteoblast number; Oc.N, osteoclast number; %Ob.Pm, osteoblast number per mm on trabecular bone surface; %Oc.Pm, osteoclast number per mm on trabecular bone surface).

