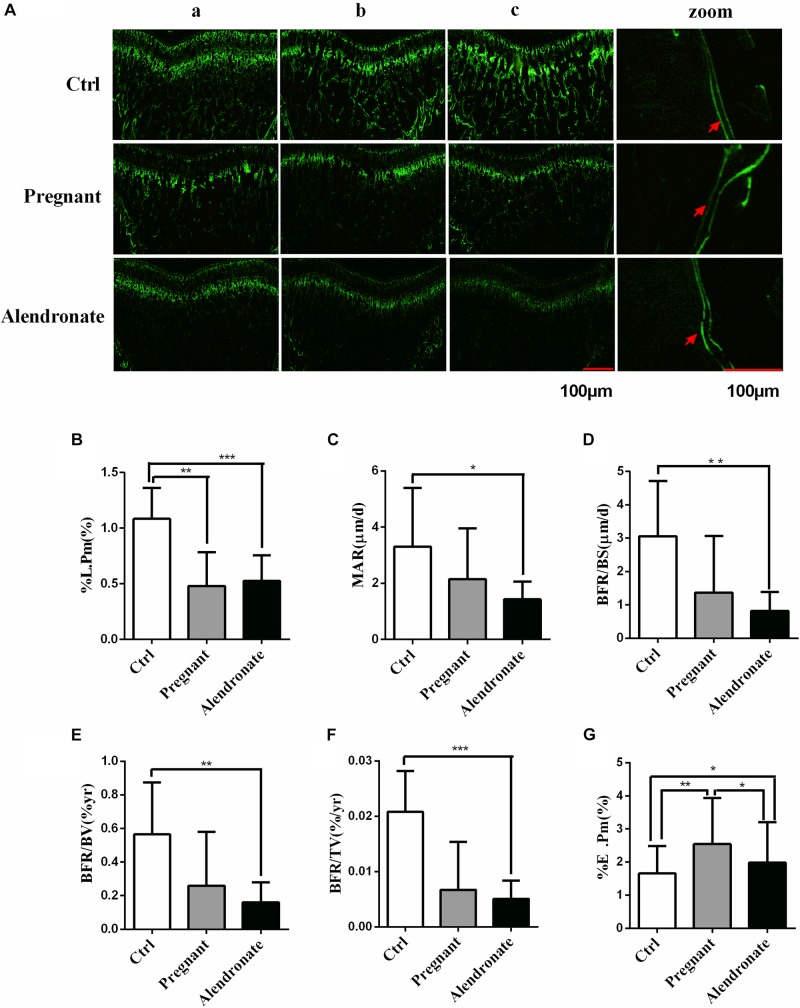
FIGURE 5.
Group comparisons in dynamic parameters of maternal rats PTM Green labels compact bone and trabecular, red arrow indicates double fluorescence. (A) The fluorescence image of PTM, whereas (zoom) is the higher-magnified microscopic image, the red arrows indicated the positions of double calcein fluorescence label. (a–c) Representative images from different animals in the same treatment group. (B–G) Dynamic parameters of PTM. ∗P < 0.05, ∗∗P < 0.01, ∗∗∗P < 0.001 (%L.Pm, labeled perimeter; MAR, mineral apposition rate; BFR/BS, trabecular bone surface-based bone formation rate; BFR/BV, trabecular BV-based bone formation rate; BFR/TV, total TV-based bone formation rate; %E.Pm, trabecular absorption rate).

