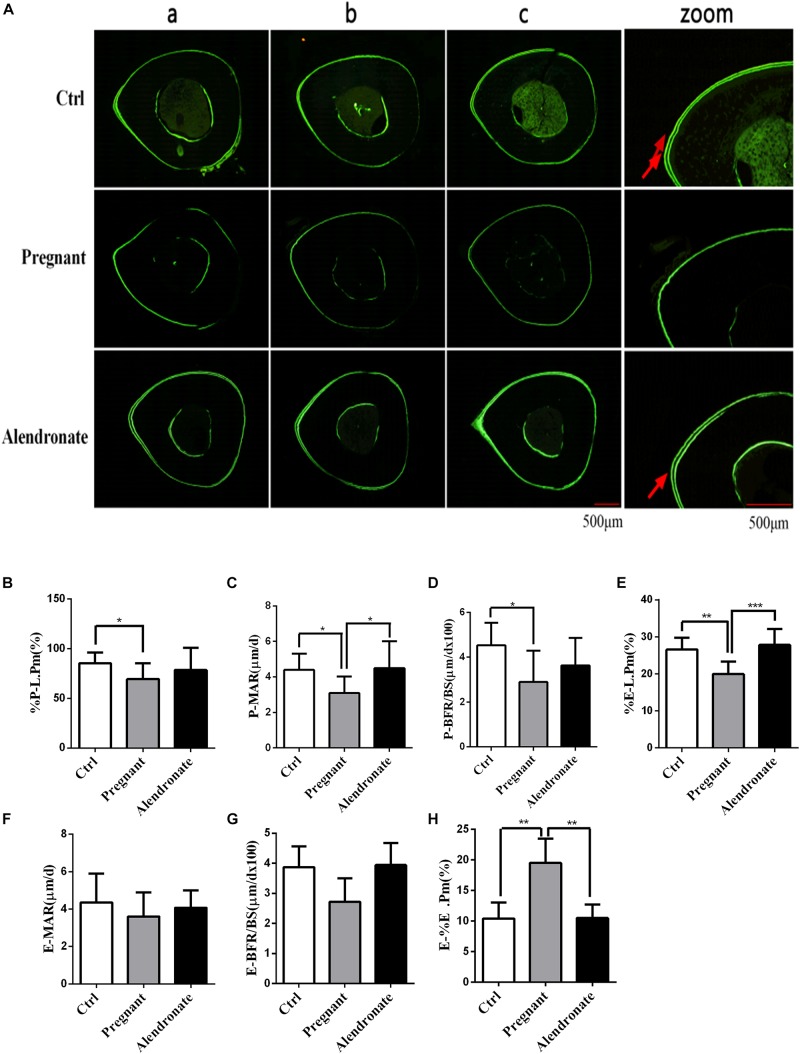
FIGURE 7.
Changes in dynamic parameters of cortical bone with or without Alendronate treatment in pregnant mice. (A) Fluorescent image indicating horizontal cross-section of TX. Panel (zoom) is the zoom-in image of (b) while the red arrows indicated the positions of double calcein fluorescence label. (a–c) Representative images from different animals in the same treatment group. (B–H) Dynamic parameters of tibia diaphysis. *P < 0.05, **P < 0.01, ***P < 0.001 (%P-L.Pm, periosteal labeled perimeter; %E-L.Pm, endosteal labeled perimeter; E-BFR/BS, endosteal bone formation rate; E-MAR, endosteal MAR; P-BFR/BS, periosteal bone formation rate; P-MAR, periosteal MAR; E-%E.Pm, endosteal bone absorption).

