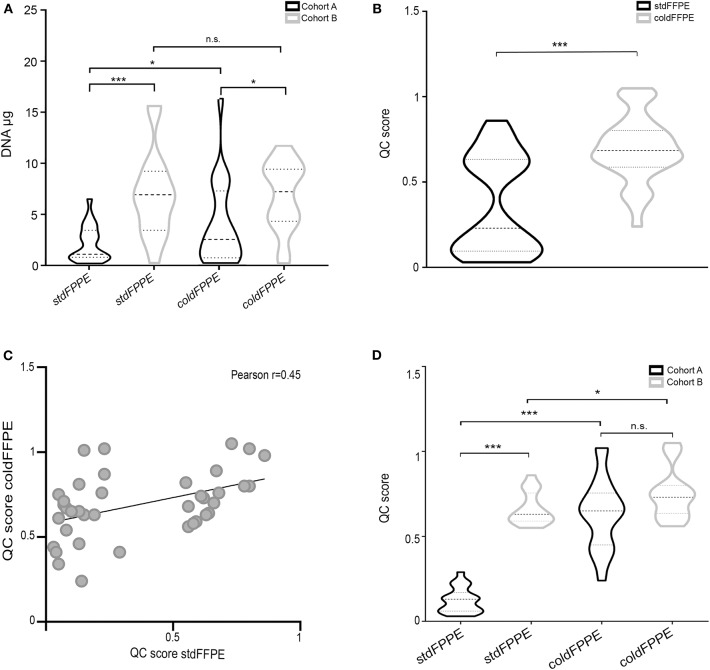
Figure 2.
Quantity and quality of DNA extracted from parallel samples. (A) DNA quantification of samples. Violin plots representing the DNA μg purified from the specimens, grouped according to the fixation methods (stdFFPE and coldFFPE) and the time of cohort collection [Cohort A (collected 6 years prior to the study with DNA extraction at present time); Cohort B (collected at time of the present study with contextual DNA extraction)]. Cohort A was characterized by higher DNA yields for coldFFPE compared to stdFFPE samples (4.1 μg vs. 2.1 μg, p = 0.04). As for Cohort B, violin plots showed a median-around density distribution for both stdFFPE and coldFFPE samples that was significantly higher compared the same fixation protocol of Cohort A (p = 0.03 for cold fixation and p =0.0001 for standard fixation). (B) Violin plots representing the QC score distribution in the groups clustered according to fixation method. The stdFFPE cohort was characterized by heterogeneous QC scores with several samples in the low range (wider diameters of the black violin) and the DNA fragmentation was statistically significantly higher than in coldFFPE (gray violin). (C) Dot plot illustrating the Pearson correlation between the QC scores of corresponding samples fixed with the two protocols. The absence of a robust correlation suggests the reduced influence of the intra-individual fragmentation on the QC score. (D) QC distribution among the sample sets. Violin plots representing the QC score of the samples, which are grouped according to the fixation methods (stdFFPE and coldFFPE) and the time of collection [Cohort A (collected 6 years prior to the study with DNA extraction at present time); Cohort B (collected at time of the present study with contextual DNA extraction)]. The QC scores of coldFFPE samples are comparable between the two cohorts, regardless of time of collection/fixation (p = 0.79), whereas the QC score of stdFPPE samples are significantly lower in Cohort A compared to Cohort B (p < 0.0001). Notably, the DNA purified from Cohort B samples displayed a better preservation in both stdFFPE and coldFFPE, nevertheless coldFFPE samples still showed a higher QC distribution. n.s. not significant, *p < 0.05, ***p < 0.001.

