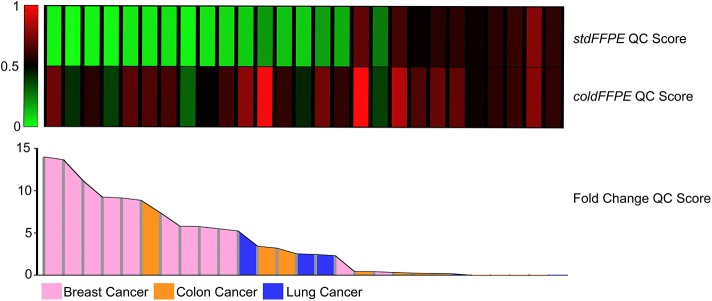
Figure 3.
QC score and QC score fold change in breast, colon, and lung carcinoma samples. The heatmap represents the QC score for purified DNA from stdFFPE and coldFFPE samples. The histogram shows the fold changes of the QC score in coldFFPE compared to the corresponding stdFFPE samples. The order of the samples in the heatmap is defined by the color in the histogram. All the breast stdFFPE samples shows the lowest QC score level, which is less heterogenous among the coldFFPE specimens. Nine of the first ten samples with and increased level of DNA integrity have a mammary site of origin, confirming the specific improvement for breast cancer tissue.

