Figure 4.
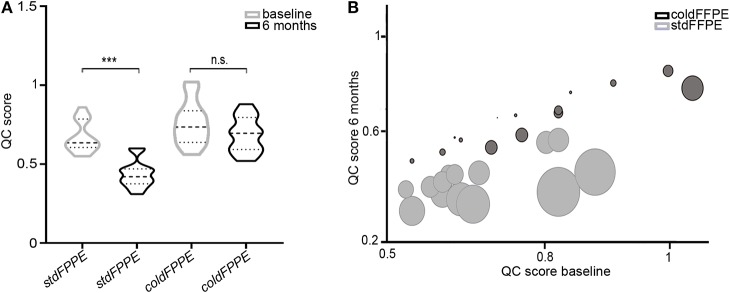
QC score distribution in the subgroup analysis of the 14 tissue pairs with a second DNA extraction after 6 months from collection/fixation. (A) Violin plots representing the QC scores in a head to head comparison between DNA extraction at baseline and after 6 months, subdivided by standard fixation (stdFFPE) and cold fixation (coldFFPE). Significantly lower QC scores are observed after 6 months in stdFFPE samples, whereas comparable QC scores are displayed for coldFFPE samples. (B) Bubble plot of the QC score for each patient. The plot showed the basal QC score on the Y axes and the 6-month QC score on the X axes, paired for each sample. The bubble size illustrates the drop in terms of QC score for each couple of DNA samples purified after 6 months of archival. n.s. not significant, ***p < 0.001.

