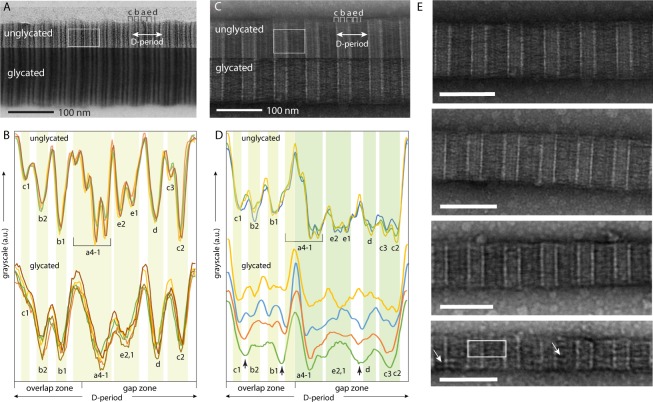
Figure 2.
(A,B): Bright-field (BF) TEM of positively-stained (uranyl acetate) collagen fibrils. (A) Comparison of TEM images of glycated (top) and unglycated (bottom) collagen fibrils. The differences in overall image brightness between glycated and unglycated are arbitrary and used here to distinguish the images of the glycated/ unglycated fibrils. The sub-bands for one fibril D-period are labelled44 for the same fibril D-period definition as in Fig. 1. The white rectangle indicates the typical region size over which the densitometry plots in B are calculated. (B) Densitometry plots (image intensity profiles) for representative D-periods for glycated and unglycated collagen fibril images, examples of which are shown in (A). The expected positions of the sub-bands for unglycated fibrils are indicated. (C,D): Bright-field (BF) TEM images of negatively-stained (uranyl acetate) collagen fibrils, equivalent to those in (A,B). In (D), the densitometry plots for unglycated collagen are from randomly selected D-periods on a single collagen fibril; plots are highly similar for all unreacted fibrils examined. Those for the glycated collagen are from the glycated collagen fibrils in (E) for a single D-period (as exemplified by the white rectangle). The uppermost densitometry plots for glycated collagen fibrils in (D) (blue and green) are from thicker fibrils (top two fibril images in (E) and the bottom two densitometry plots (yellow and brown) are from thinner fibrils (bottom two fibril images in (E). Dotted lines in densitometry plots in B and D indicate where relative image intensity is significantly reduced for glycated fibrils compared to unglycated fibrils. Scale bars in (E) are 100 nm.

