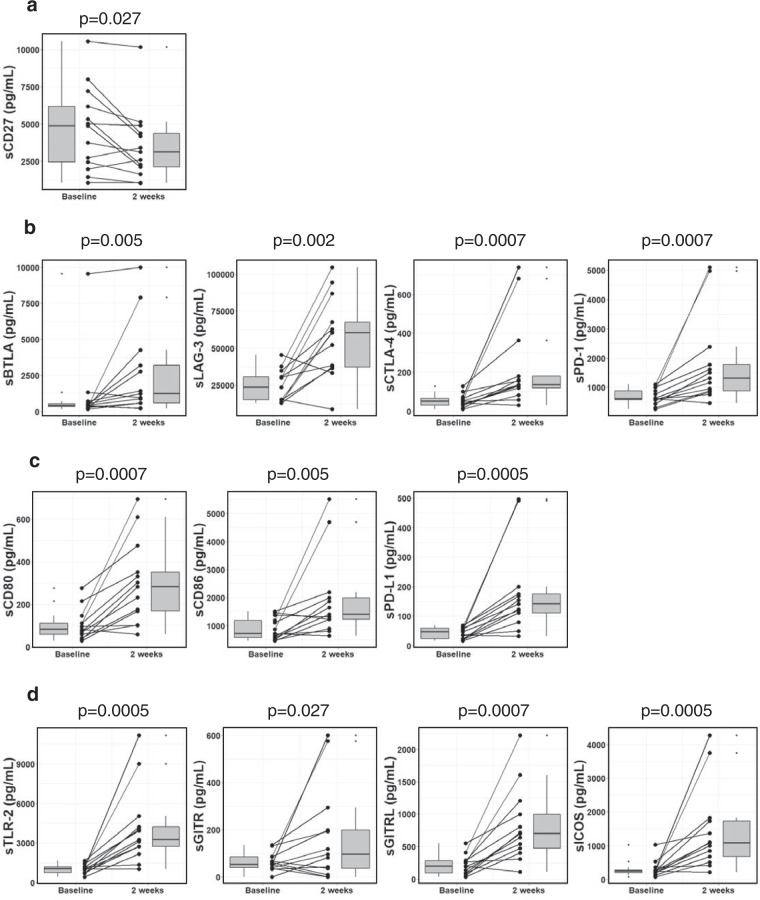
Figure 2.
Profiling of soluble immune checkpoint protein levels after sorafenib treatment. Box plots of soluble proteins levels in patients with HCC at baseline and 2 weeks of treatment (a) sCD27; (b) sBTLA, sLAG-3, sCTLA-4 and sPD-1; (c) sCD80, sCD86 and sPD-L1; (d) sTLR, sGITR, sGITRL and sICOS. Ggplot247 package was used for creating graphics. The vertical length of the box shows the interquartile range. The lines in the boxes shows the median values. The error bars show the minimum and maximum values (range). Wilcoxon signed-rank test was used. A p value of <0.05 was considered statistically significant.

