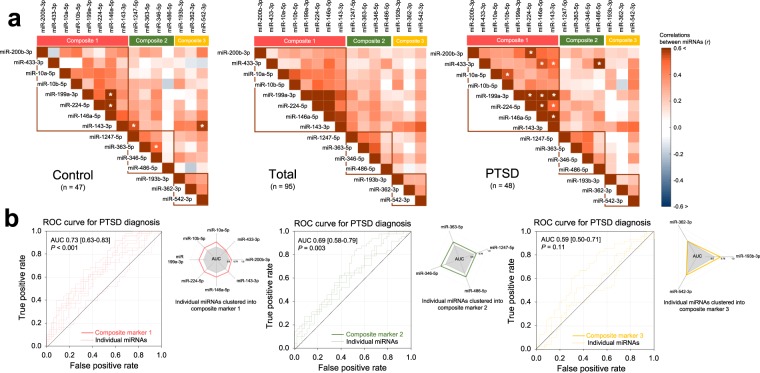
Figure 1.
Clustering of miRNA candidates and evaluation of each resulting cluster in predicting PTSD diagnosis. (a) Using a principal component analysis, three composite markers were derived in a data-driven manner, consisting of highly correlated miRNAs showing a similar expression profile within each subset. Asterisks (*) in the correlation matrices of the PTSD (right panel) and control (left panel) groups indicate significant correlations at Bonferroni-corrected P < 0.05. (b) A standardized expression value of each composite marker calculated by averaging the z scores of the relative expression values of the circulating exosomal miRNAs. Diagnostic performance of each composite marker to discriminate recently traumatized individuals with PTSD from trauma-unexposed healthy individuals was evaluated with the ROC curve analysis. AUC measures indicate the discriminatory power of each composite marker, which was internally validated using 1,000 bootstrap resampling, with AUC measures of individual miRNAs within each composite marker presented in radar charts. miRNA microRNA, PTSD posttraumatic stress disorder, ROC receiver operating characteristic, AUC area under the ROC curve.

