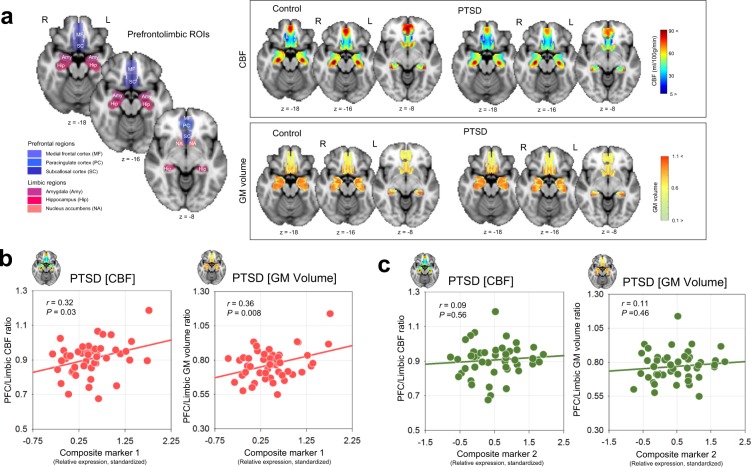
Figure 3.
Neural correlates of candidate miRNA expression profile in PTSD. (a) Anatomical localization of the prefrontolimbic regions that were predefined as ROIs in this study. Mean CBF (upper panel) and GM volumes (lower panel) in the prefrontolimbic ROIs for each PTSD and control group are overlaid on the axial planes of the standard Montreal Neurological Institute template. (b) Scatterplots and regression lines to show the association of standardized values of miRNA expression for composite marker 1 with the ratio of CBF and GM volume between prefrontal and limbic regions of the brain, respectively. (c) Scatterplots and regression lines to show the association of standardized values of miRNA expression for composite marker 2 with the ratio of CBF and GM volume between prefrontal and limbic regions of the brain, respectively. P values in the scatter plots indicate 5,000 permutation-adjusted values. miRNA microRNA, PTSD posttraumatic stress disorder, ROIs regions-of-interest, CBF cerebral blood flow, GM gray matter, L left, R right.

