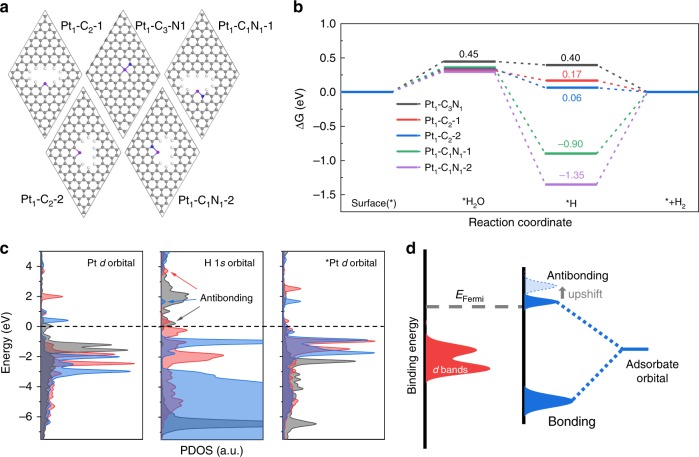
Fig. 3. Theoretical investigations.
a Computational models of the Pt1-C3N1 and two Pt1-C2 and two Pt1-C1N1 moieties. H, white; C, gray; N, blue; Pt, purple. b Calculated adsorption energies of H2O and H on the surface of Pt1-C3N1, Pt1-C2 and Pt1-C1N1. c Calculated PDOS of Pt d orbital of clean surfaces, H 1 s of hydrogen adsorbed on Pt sites and Pt d of Pt sites with adsorbed hydrogen (denoted *Pt d orbital), from left to right, respectively. The gray, red and blue contour represent Pt1-C3N1, Pt1-C2-1, and Pt1-C2-2 surfaces, respectively. The DOS peaks of H1s-Pt 5d antibonding are indicated by the arrows. Note that the sharp peak ∼ −1 eV for Pt1-C2-2 represent bonding rather than antibonding state, as it corresponds to the prominent Pt d band in the *Pt d PDOS. d Schematic DOS illustration of the interaction between Pt and H, the H 1 s states split into bonding and antibonding states. With four-coordinate Pt evolving to two-coordinate, the corresponding antibonding states upshift to a higher energy with a lower occupancy.

