
Figure 7.
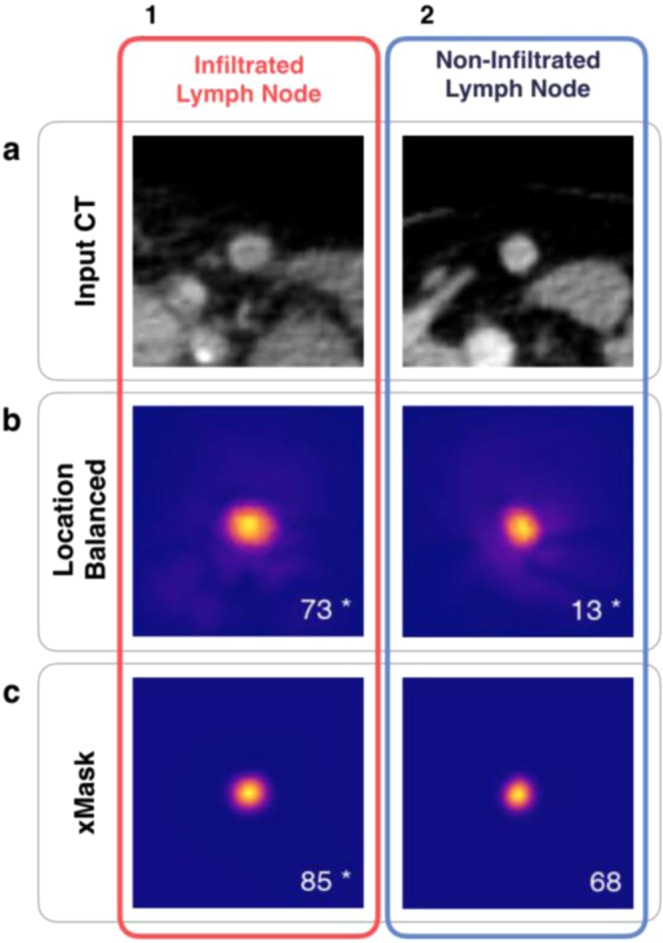
Limitations of heatmaps as tool to explain black box predictions. (a) Contrast-enhanced CT images for two inguinal lymph nodes that were used as input to generate all heatmaps displayed, with (1) a lymph node positive for infiltration by PCa, and (2) a lymph node negative for infiltration. In (b,c) heatmaps produced by two CNNs trained with location balanced training data, or masked input data, respectively. Beyond verifying that the lymph node is important for classification, heatmaps provide little additional information as to why classification output was either true positive (b1,c1), true negative (b2), or false positive (c2).