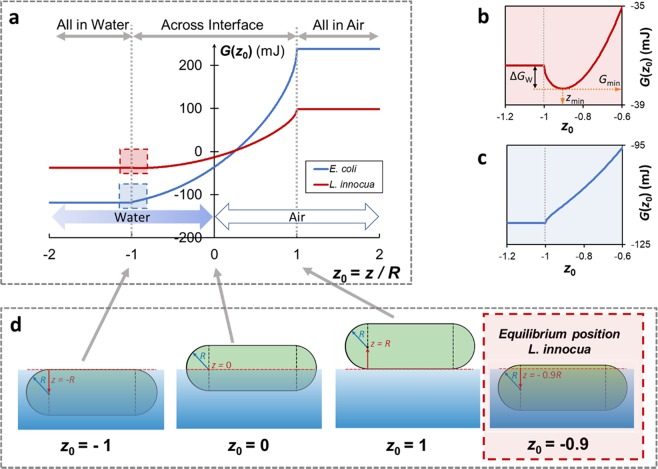
Figure 5.
A thermodynamic model of bacterial distribution at the water-air interface. (a) System surface energy, G, as a function of the relative position, z0, of an E. coli (EC, blue) or L. innocua cell (LI, red). z0 is defined as the vertical coordinate of the center of the cell with regard to the water level, z, normalized by the radius of the cell, R. (b) and (c): enlarged view of the energy curves at the ‘escape-to-water’ point (z0 = −1) for L. innocua (red box) and E. coli (blue box), respectively. ∆Gw is the energy barrier a cell needs to overcome to escape into the bulk water phase from the equilibrium position, zmin. (d) Schematic illustration of various positions of a cell relative to the interface. The equilibrium position for L. innocua (z0 = −0.9) is highlighted by the red dashed square.

