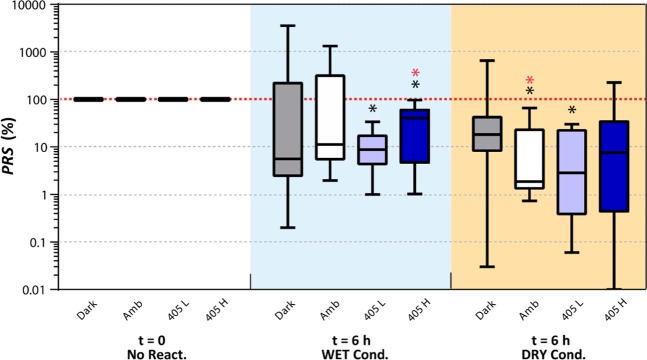
Figure 6.
Box-and-whisker plot for post-reactivation survival (PRS) rate of L. innocua in the DRY and the WET condition under various lighting conditions: dark, ambient light (‘Amb’), low-intensity 405 nm LED (‘405 L’), and high-intensity 405 nm LED (‘405 H’). The line dividing each box into two parts represents the median, the top and the bottom of the boxes represent upper and lower quartiles, and the upper and the lower whiskers represent the max and the min values, respectively. Black asterisks denote significant difference in PRS compared to ‘100%’ without adjusting for multiple comparison (p < 0.05); red asterisks denote significance after adjusting for multiple comparison (padj < 0.05).

