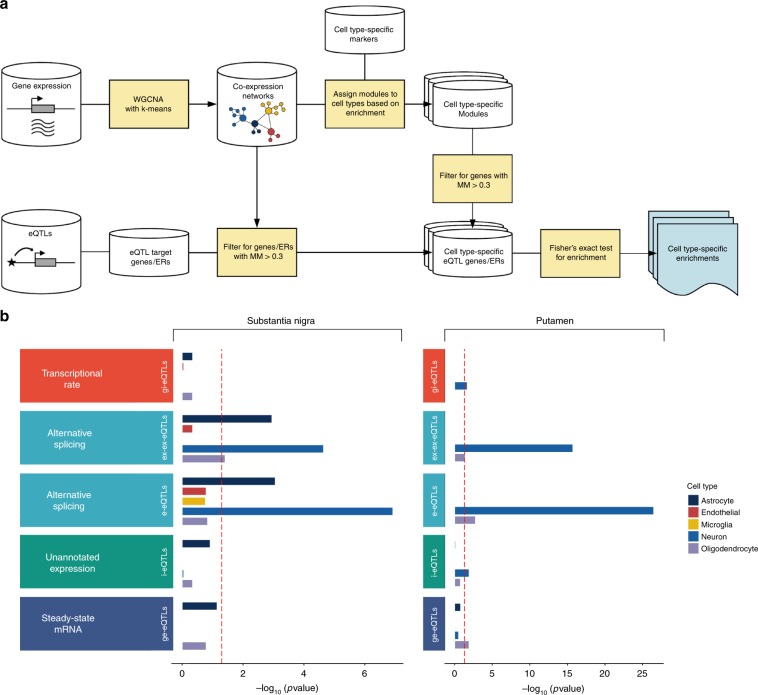
Fig. 4. Non-standard eQTL analyses produce additional biologically relevant information.
a Schematic diagram showing the use of gene co-expression networks to assign eQTL target genes and unannotated expressed regions (ERs) to the cell type most likely to be driving gene expression in the tissue. We used the WGCNA R package63. b eQTL classes were variably enriched for genes with cell-biased expression, highlighting the importance of capturing this information. Enrichment of genes with cell-biased expression within eQTL targeted expression features was performed separately for each tissue and was determined using a Fisher’s Exact test and a significance cutoff of P < 0.05 (dashed red line at −log10(P) = 1.30). Genes assigned to modules significantly enriched for brain-related cell type markers and with a module membership of > 0.3 were allocated a cell type. Next, for each eQTL targeting a known genic region or an unannotated expressed region with high or moderate evidence linking it to a known gene, if the target gene was allocated to a cell type then the related eQTL received the same cell type label. For eQTLs targeting unannotated expressed regions with low evidence for association with a known gene or which could not be classified, we assigned the target expression feature to a module (and by inference a cell type) based on its highest module membership providing the module membership was at least 0.3. Finally, for each eQTL class and each cell type, namely neuron, microglia, astrocyte, oligodendrocyte, and endothelial cell, we applied a Fisher’s Exact test to test for enrichment of that cell type label among the genes associated to the eQTL class. Expression features targeted by different eQTL classes were variably enriched for genes with cell-biased expression, highlighting the importance of capturing this information. Enrichment of genes with cell-biased expression within eQTL targeted expression features was performed separately for each tissue and was determined using a Fisher’s Exact test and a significance cutoff of P < 0.05 (dashed red line at −log10(P) = 1.30). Source data are provided as a Source Data file.

