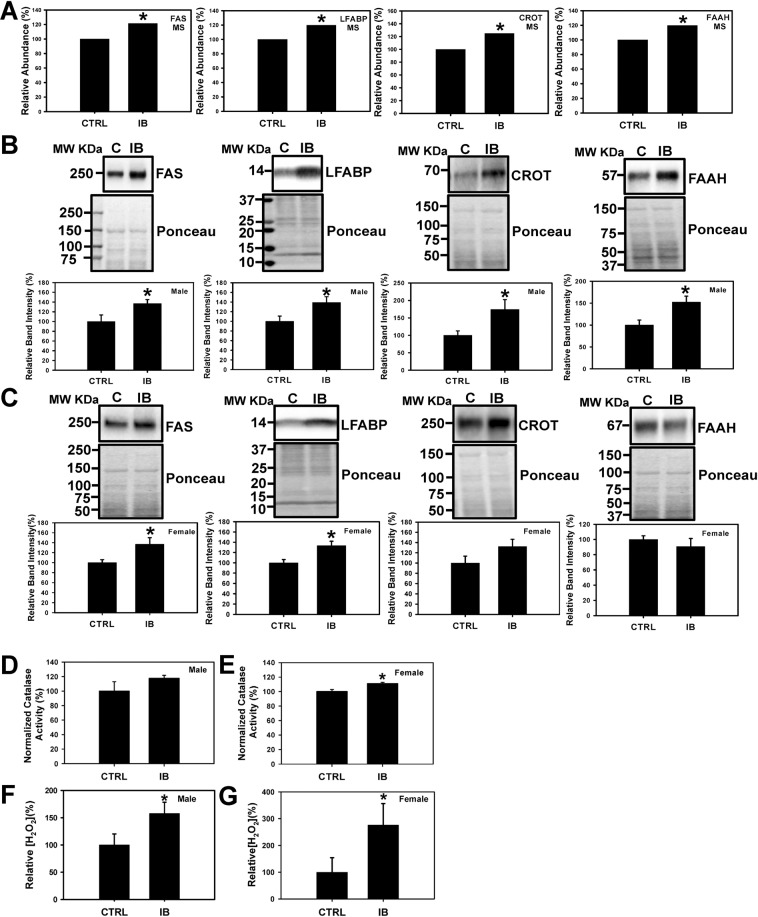
Figure 4.
Validation of expression levels of proteins related to fatty acid metabolism pathway in male and female mouse liver. (A) Changes in the level of proteins FAS (Fatty Acid Synthase), LFABP (Liver Fatty acid-binding protein), CROT (carnitine O-octanoyltransferase), and FAAH (fatty acid amide hydrolase) obtained from mass spectrometry. Western blots and corresponding semi quantitative bar graphs for proteins, FAS, LFABP, CROT, and FAAH and total protein (used as a loading control) (B) Male liver and (C) Female liver. Value are mean ± SE; n = 4–6 per group. *p < 0.05. Characterization of antioxidant catalase activity and hydrogen peroxide levels in control and ibuprofen-treated mouse livers. (D), (E) Catalase activity in male and female mouse liver. (F), (G) Relative hydrogen peroxide (H2O2) levels of male and female liver lysates. Value are mean ± SE; n = 5 per group. *p < 0.05.

