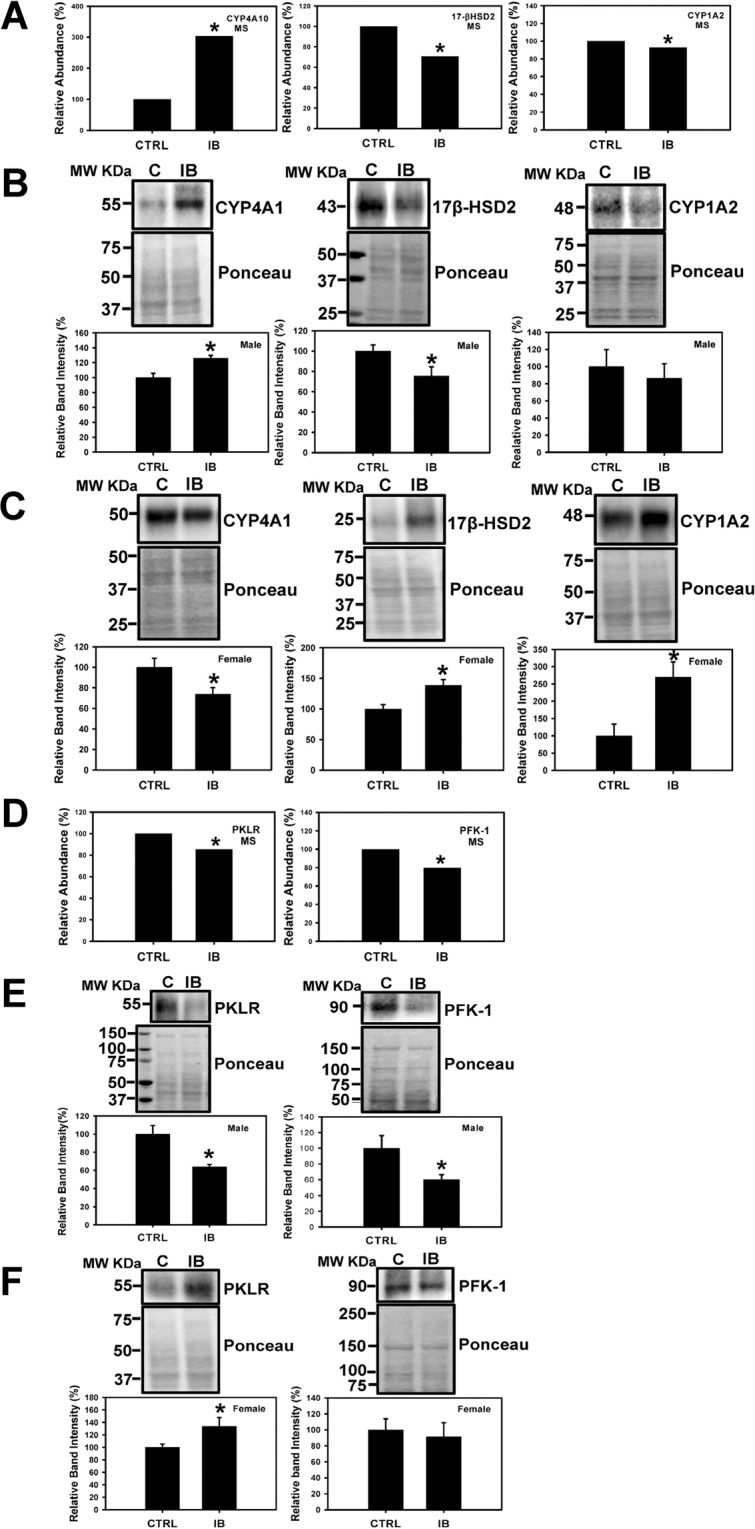
Figure 6.

Determination and validation of expression levels of proteins related to fatty acid metabolism and glycolytic pathways in mouse liver. Changes in level of CYP4A10 (Cytochrome P450 4A10), 17β-HSD2 (17β hydroxysteroid dehydrogenase type 2), and CYP1A2 (Cytochrome P450 1A2) obtained by mass spectrometry (A). Western blots and corresponding semi quantitative bar graphs for CYP4A1, 17β-HSD2, and CYP1A2 (Cytochrome P450 1A2) and total protein (used as a loading control). (B) Male liver and (C) Female liver. Value are mean ± SE; n = 4–6 per group. *p < 0.05. (D) Proteomic analysis and Western blots of proteins, PKLR (pyruvate kinase, liver and RBC), and PFK-1 (Phosphofructokinases-1), total protein (used as a loading control) and corresponding semi- quantitative bar graphs are shown for (E) male mice liver, and (F) female mice liver. Value are mean ± SE; n = 4–6 per group. *p < 0.05.
