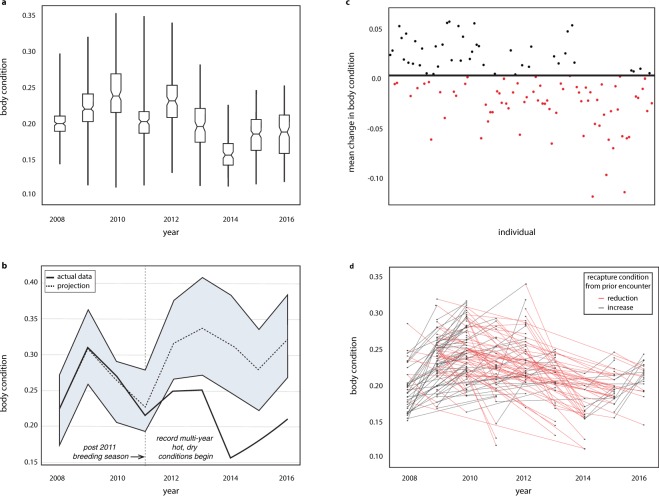
Figure 2.
Impacts of climate change on body condition for a population and its individuals. (a) The SMMNRA population experienced a significant change to variance in body condition through time (F1,7 = 5.90, P < 0.041). Notched boxes show annual median body condition and 95% confidence intervals. Non-overlapping notched boxes suggest significant differences between medians. Whiskers extend through the range of recorded values. (b) Bayesian estimates of body condition differed significantly from observed values (P < 0.001) during peak drought and record temperatures. The blue shaded area shows the 95% confidence interval around predicted values. The solid line shows the actual data and how it deviates from estimates during record warm, dry years. Within the SMMNRA population, mean change in body condition (c) shows that nearly two thirds of individuals experienced a net reduction to body condition between 2008–2016. Each dot represents an individual and the overall change one experienced as either a net increase (black) or decrease (red). The pattern of loss in this population is corroborated by tracking individual recaptures. (d) Black points show each recapture event and lines show whether the individual increased (black) or decreased (red) body condition from prior recapture events.

