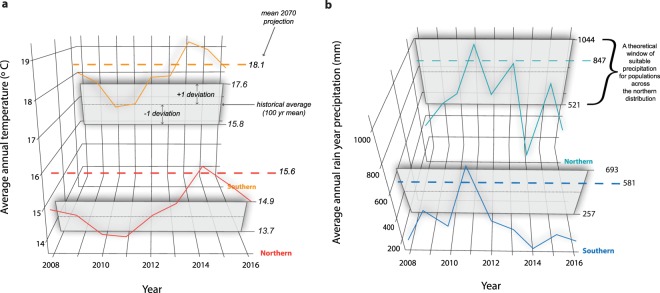
Figure 3.
20th century precipitation and temperature windows. Temperature (a) and precipitation (b) data collated from all known breeding sites throughout northern and southern distributions (z-axis) shape the climate windows for these regions. Each window is formed by a regional mean and standard deviation (±1) value calculated using PRISM annual values based on 1900–2000 data. During our study period, precipitation and temperature deviations in the southern distribution have remained outside of 20th century windows since 2012. Mean 2070 predicted values are presented as dashed horizontal lines and are based on estimates from CCSM RCP 6.0 data.

