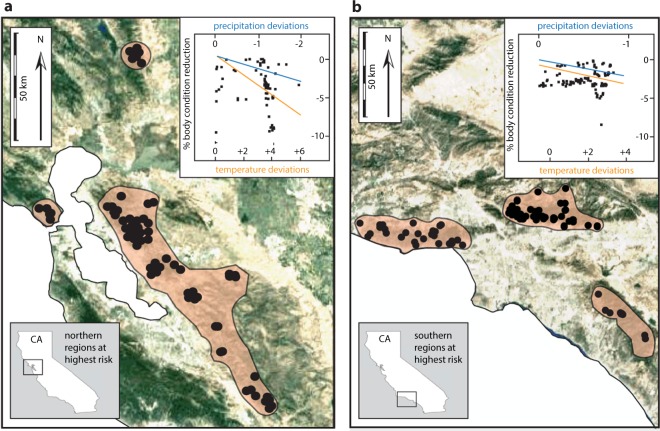
Figure 4.
California regions at highest risk in the 21st century. Inset graphs show the (a) northern and (b) southern populations predicted to experience a loss in body condition as a result of future regional climate deviations. Satellite images present the spatial distribution of these populations and the regions they occupy. Trend lines represent the magnitude of precipitation (blue) and temperature (orange) deviations driving body condition reductions. Note that the magnitude of temperature deviations in both regions is predicted to drive body condition reductions more so than precipitation deviations, especially in northern populations (a). Maps were rendered in R35 using packages ggplot236 and ggmap37.

