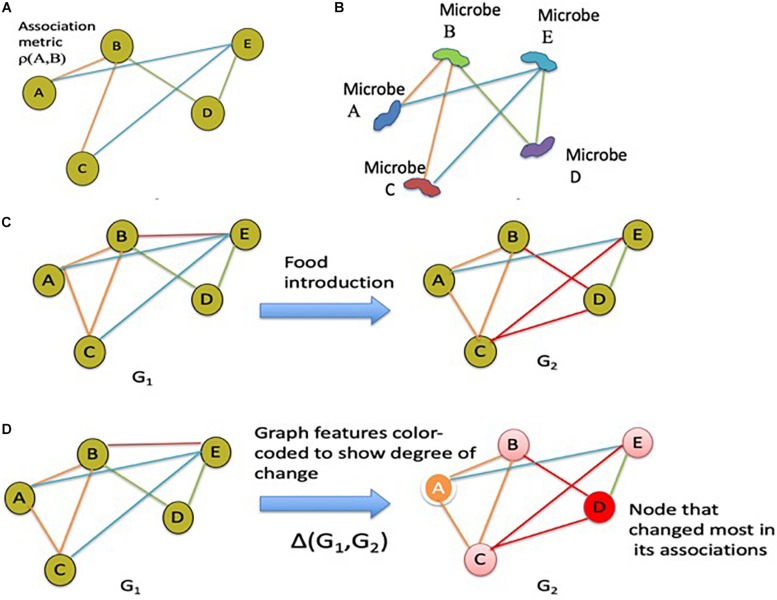
FIGURE 4.
Association graphs demonstrating microbial co-occurrence networks and microbial composition changes over time. These association graphs can be included into metacommunity models such as the one in Figure 1. (A) Schematic diagram of an association graph. (B) Schematic microbial co-occurrence network based on the association graph shown in panel A. (C) Schematic showing the changes in gut microbiota associations within an individual in response to the introduction of food; other external stressors can be considered equivalently. (D) Variation of the schematic shown in panel C with color-coding to show the degree of change at each node.

